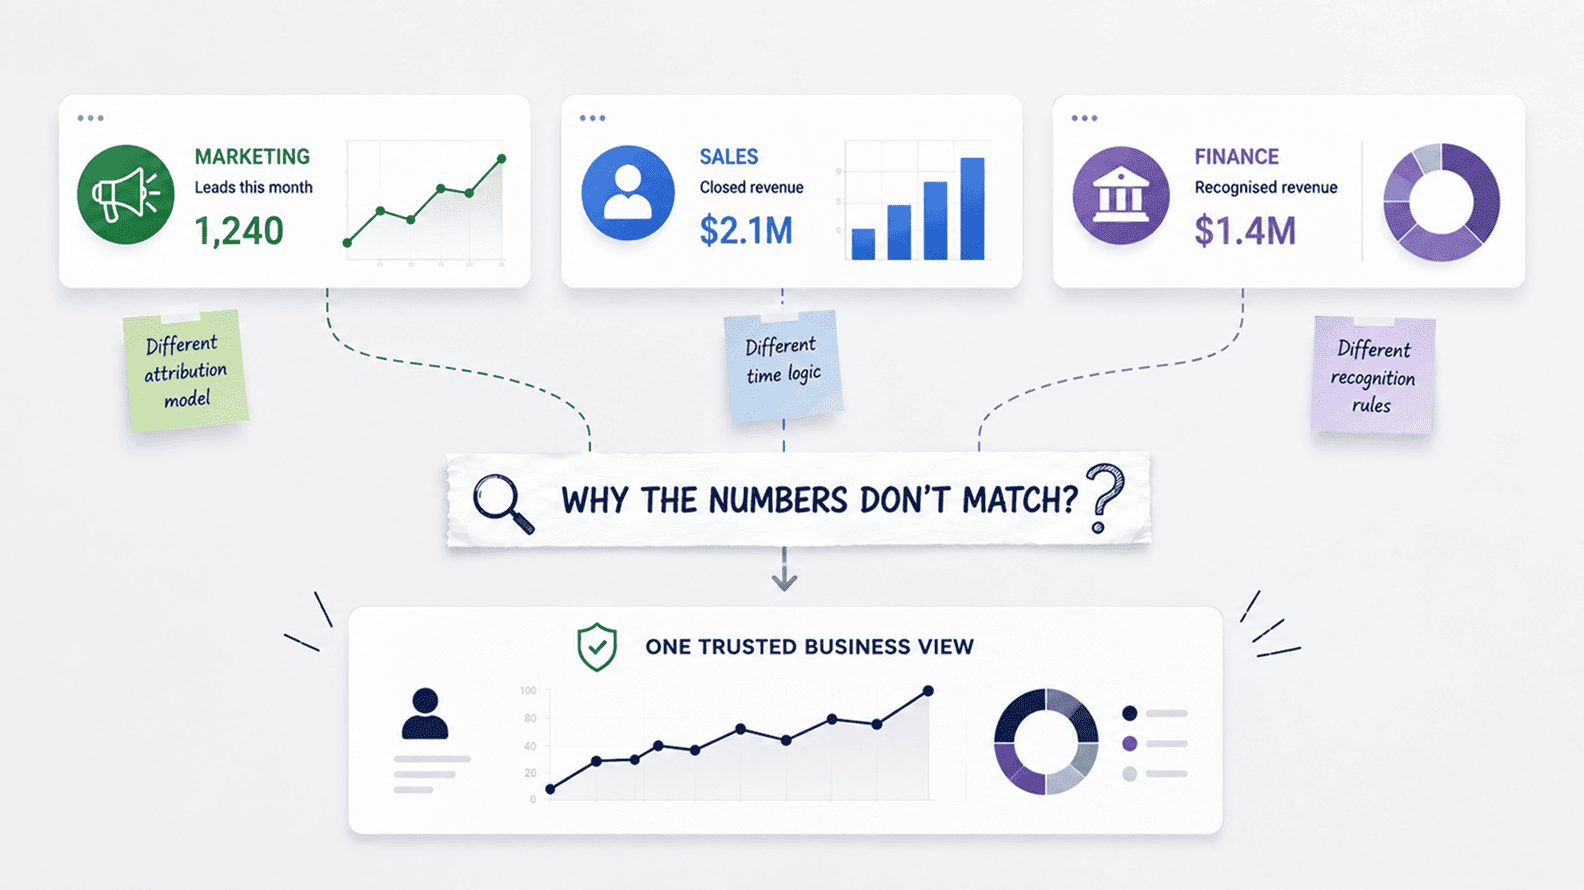
Why Marketing, Sales, And Finance Reports Do Not Match
Aug 04, 2026 / 27 min read
August 4, 2026 / 22 min read / by Team VE
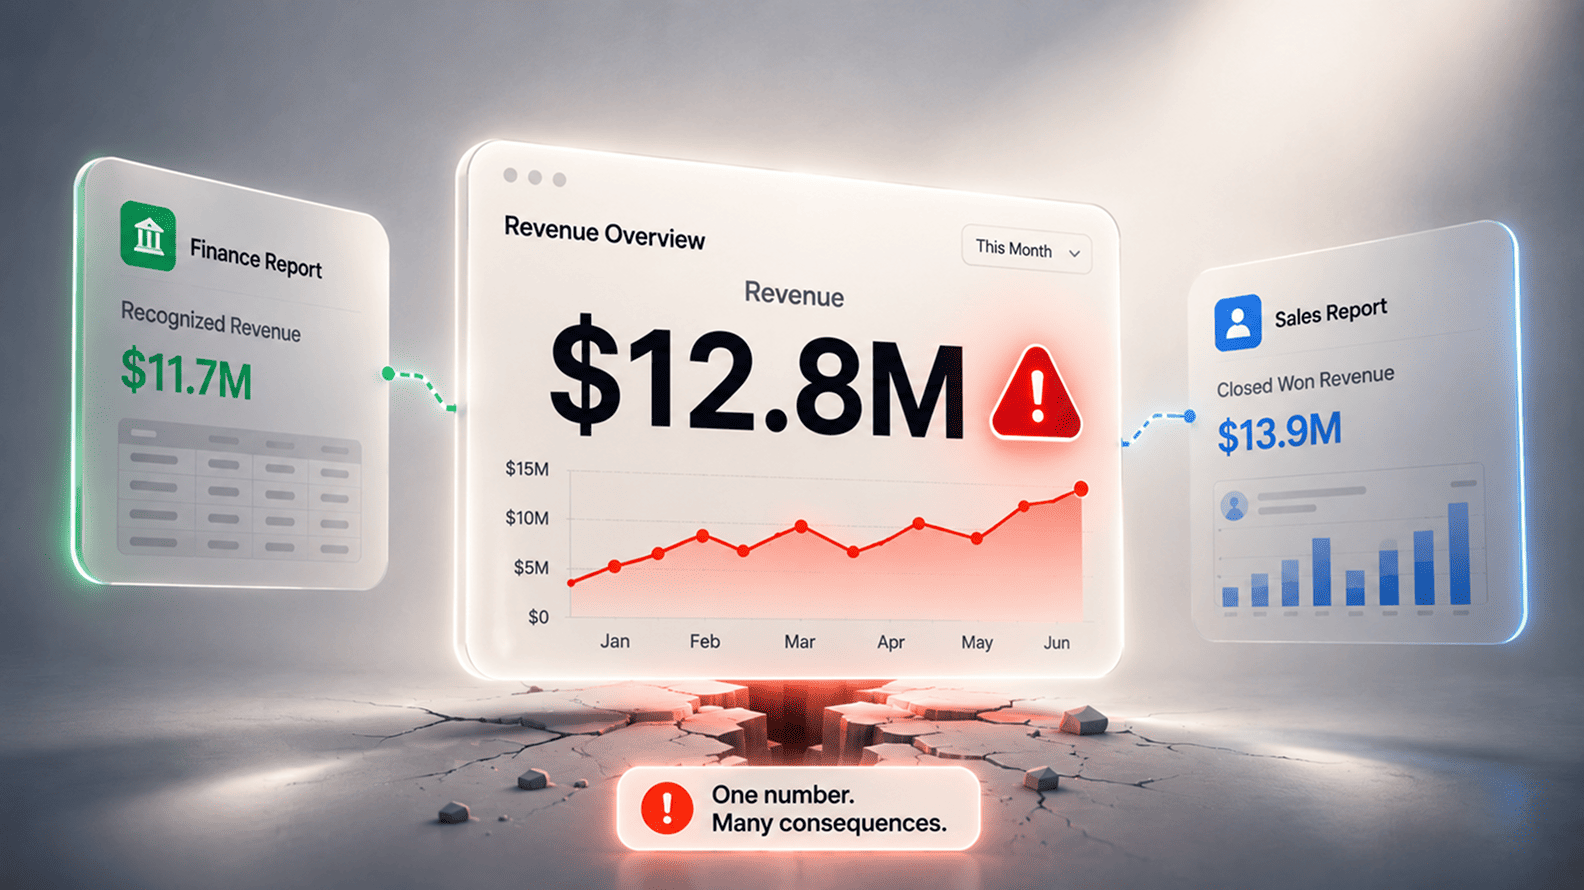
A practical business guide to why revenue dashboards go wrong, how the damage spreads across decisions, and what companies should fix before trust breaks.
A wrong revenue dashboard does not only show the wrong number. It changes the conversation around the business. Sales may believe growth is stronger than it is, finance may struggle to reconcile the figure, marketing may defend spend against a misleading return view, and leadership may make hiring, budget, forecast, or investor-facing decisions from a number that has not earned that level of trust.
Revenue is especially dangerous because people treat it as the clearest fact in the company, even when the dashboard is mixing bookings, invoices, cash collected, recognized revenue, refunds, credits, tax, currency, or one-time adjustments.
The most important fix is not another chart. It is a shared revenue language. A company has to know which revenue view a dashboard is showing, who owns that definition, which source system has authority, which date drives the period, what is excluded, how refunds and credits are handled, and whether the number is ready for the decision attached to it.
A dashboard can be fast, polished, and technically correct in one sense while still being commercially misleading if the revenue definition is wrong for the meeting.
A wrong revenue dashboard is a reporting view that presents revenue in a way that does not match the business decision it is being used for. The number may be wrong because the calculation is incorrect, but it may also be wrong because the dashboard is using the wrong revenue type. Booked revenue, billed revenue, collected cash, recognized revenue, gross revenue, net revenue, recurring revenue, and expansion revenue all answer different questions.
This is why revenue dashboards need more care than ordinary activity reports. Revenue is not just a total. It is a business claim about timing, customer obligation, accounting treatment, commercial momentum, and cash reality.
The IFRS Foundation explains that IFRS 15 is concerned with the nature, amount, timing, and uncertainty of revenue and cash flows from customer contracts. That is a useful reminder for analytics teams. A dashboard that says revenue has to make clear which version of that reality it is showing.
Revenue looks simple because everyone in the company uses the word every day. A founder talks about revenue to explain growth. A sales leader talks about revenue to defend the quarter. Marketing talks about revenue to prove that campaigns are creating demand.
Finance talks about revenue with a very different level of discipline because the number may affect forecasts, board packs, lender conversations, tax, audit, and statutory reporting. The same word moves across the company, but it does not always carry the same meaning.
That is why a wrong revenue dashboard can be more damaging than a wrong traffic report or a wrong activity report. People may question a lead number or a product-usage number quickly because those metrics already feel interpretive. Revenue feels more final. Once it appears on a dashboard, people often assume the debate has ended. In reality, the debate may only be hidden inside the definition.
Groupon learned this lesson in public during its early years as a listed company. In its 2011 Form 10-K, the company disclosed a material weakness in internal control over financial reporting related to its financial statement close process, and it had previously corrected revenue presentation issues in filings around its IPO period.
The lesson for dashboards is not that every company faces a public restatement. The lesson is that revenue presentation depends on judgement, controls, and definitions. A dashboard that treats revenue as a simple extract from a sales or billing table is already taking a risk.
Inside a private company, the same issue may look less dramatic but still affect decisions. A revenue card rises sharply, but the increase includes large one-time implementation fees that will not recur. A SaaS dashboard celebrates monthly revenue, but the number includes annual contracts booked upfront rather than revenue earned over the service period.
An ecommerce view shows strong sales, but refunds and cancellations land later. A marketplace reports gross transaction value as if it were company revenue. None of these mistakes needs fraud or incompetence. They can happen when the dashboard is faster than the company’s revenue language.
When a revenue dashboard is wrong, the first problem is usually not the size of the error. It is the doubt that follows. Once finance has to correct the number in a leadership meeting, every later dashboard becomes easier to question. Sales start asking whether pipeline conversion is also off.
Marketing starts defending campaign ROI with caveats. Operations wonders whether margin dashboards are built on the same weak base. Leadership begins the next review by asking which number is real before discussing what the number means.
The trust loss is expensive because analytics depend on habit. People use dashboards when they believe the dashboard will save time and sharpen the decision. They stop using them when every number needs a side conversation.
A wrong revenue dashboard pushes the company back into private spreadsheets, finance-only files, manual reconciliations, and last-minute explanations. The BI tool may still be working, but the decision system has moved away from it.
This is especially painful because revenue sits upstream of so many other performance views. A small error in revenue can distort margin, sales productivity, customer acquisition cost, payback period, average deal size, renewal performance, and channel ROI. The dashboard may show one wrong number, but the business reads a full story from it. That is where the damage spreads.
Many revenue dashboard errors come from treating several valid numbers as if they were the same thing. Bookings can be useful for sales momentum. Billings can matter for invoicing and collections. Cash collected matters for liquidity. Recognized revenue matters for finance.
Net revenue matters when refunds, discounts, credits, and taxes change the economic picture. Recurring revenue matters when leadership is reading the quality of future income. Each number can be useful, but each belongs to a different question.
Tesco’s 2014 profit overstatement is a powerful reminder of how much timing and recognition can matter. The company announced that expected first-half profit had been overstated by an estimated 250 million pounds, principally because commercial income had been recognized too early and some costs were delayed.
The UK Financial Conduct Authority later described the issue in its Tesco redress announcement, and Tesco’s own reporting discussed the reversal of commercial income recognized in previous periods. The dashboard lesson is direct. A number can look like business performance while part of the issue is actually timing, recognition, or accrual treatment.
In everyday analytics, the confusion is often simpler. A sales dashboard may call closed-won bookings revenue because that is how the team thinks about commercial success. Finance may reject that number because the service has not yet been delivered or the invoice has not yet been issued.
A cash dashboard may show collections that came from last quarter’s sales. A product dashboard may attribute revenue to the plan a customer uses today, even though the invoice was generated under an older package. The dashboard is not always wrong because the data is bad. It is wrong because the label is too broad.
A single customer deal can travel through the company in several forms before it becomes a finance-ready revenue number. That journey is where dashboards often go wrong. The sales team may care about the signature. Billing may care about the invoice. Finance may care about the revenue recognition schedule.
Cash planning may care about when money arrives. Customer success may care about whether the account is recurring, expanding, downgrading, or at risk. A good revenue dashboard does not need to explain every accounting rule on the screen, but it does need to tell users which story they are reading.
| Dashboard Label | What It May Actually Mean | Where It Can Mislead |
| Booked Revenue | Contracted or closed-won value recorded by sales. | Useful for commercial momentum, but it can overstate what finance can recognize in the period. |
| Billed Revenue | Amount invoiced to the customer. | May differ from earned revenue when services are delivered over time or contracts include multiple obligations. |
| Collected Revenue | Cash received from customers. | Useful for cash flow, but it may relate to sales from earlier periods. |
| Recognized Revenue | Revenue recorded under accounting rules for the relevant period. | Often the safest finance view, but it may lag the sales team’s view of current momentum. |
| Gross Revenue | Revenue before refunds, discounts, credits, taxes, or partner shares. | Can make performance look stronger than the economic reality. |
| Net Revenue | Revenue after defined deductions. | Useful for business performance, but only if deductions are consistently defined. |
The easiest way to make a revenue dashboard look wrong is to use the wrong date. A company may have an order date, close date, invoice date, service-start date, payment date, refund date, renewal date, and recognition date for the same customer relationship. Each date can be legitimate, but each produces a different period view.
This matters most when leadership is reading trends. A dashboard based on close date may show a strong quarter because sales closed several large contracts. A dashboard based on invoice date may show a weaker quarter because billing lagged.
A dashboard based on recognition date may spread the same value across several months. A dashboard based on cash date may show strength later, when collections arrive. The company may not have a revenue problem at all. It may have four timelines fighting under one label.
The issue becomes sharper in subscription, services, marketplace, and project-based businesses. Annual contracts, milestone billing, implementation fees, credits, delayed go-lives, usage-based pricing, and partner revenue shares all make period logic more sensitive. If the dashboard does not show which date drives the number, users are left to interpret movement as performance when it may simply be timing.
Revenue dashboards often look cleanest before the business has absorbed the messy parts of revenue. Refunds may come after the sale. Credits may be issued by finance. Cancellations may sit in a support or subscription platform. Chargebacks may arrive through payments data. Discounts may live in the contract, the invoice, or a side approval. If the dashboard reads only the happy path, it can show growth before the economics have settled.
This is common in ecommerce and digital services. A campaign may drive a spike in orders, and the revenue dashboard may treat that as success. A week later, returns, failed payments, discount leakage, or poor-quality customers tell a different story.
The same issue appears in B2B when a deal is booked at full value but later adjusted through credits, concessions, delayed implementation, or scope changes. The wrong dashboard does not need to invent revenue. It simply reads revenue too early or too generously.
A mature revenue view keeps optimism and reality close together. It lets commercial teams see momentum, but it also gives finance and leadership a view of what remains after adjustments. That difference is crucial because companies do not make decisions from sales energy alone. They make decisions from the revenue that survives the full business cycle.
Revenue is rarely a lonely metric. Once it appears in a dashboard, other numbers gather around it. Marketing uses revenue to defend spend and judge channel quality. Sales uses it to measure productivity, quota, average deal size, and conversion.
Finance uses it for forecast, margin, cash planning, and variance analysis. Customer success uses it to understand expansion, contraction, renewal quality, and account value. A wrong revenue base weakens all of those views at the same time.
| If The Dashboard Uses | It May Be Right For | It May Be Wrong For |
| Closed-won bookings | Sales momentum and pipeline conversion discussions. | Finance reporting, cash planning, and period revenue analysis. |
| Invoice value | Billing operations and collections follow-up. | Understanding whether revenue has been earned under the contract. |
| Cash collected | Cash flow, liquidity, and working-capital review. | Current-period sales performance or campaign effectiveness. |
| Recognized revenue | Finance reviews, board reporting, margin analysis, and period performance. | Real-time sales coaching or immediate campaign pacing. |
| Gross sales | Topline demand signals and order activity. | Profitability, net growth, and marketing ROI when refunds or credits are material. |
A revenue dashboard needs shared ownership because neither finance nor analytics can solve the problem alone. Finance understands recognition, cut-off, accruals, refunds, credits, tax treatment, and the difference between operational and reportable revenue.
Analytics understands the source systems, joins, transformations, dashboard logic, refresh cadence, and the places where local calculations can drift. The strongest setup brings those two strengths together.
This is also why revenue deserves a higher governance bar than many other dashboards. The PCAOB has long treated revenue as an area that can carry audit risk, and its practice alert on auditing revenue highlighted frequent audit deficiencies in this area. An internal dashboard is not an audit opinion, but the signal is useful. Revenue is complex enough that companies should be careful about who is allowed to define it and where the official logic lives.
In practice, finance should approve the revenue definitions used for serious reporting, analytics should implement those definitions in reusable logic, and business teams should understand which view belongs in which meeting. Sales can still have a bookings dashboard. Marketing can still have an influenced-revenue view.
Customer success can still track renewal and expansion. The mistake is letting those views travel into leadership or finance conversations without their labels, limits, and owners.
A good revenue dashboard does not need to become an accounting manual. Users should not have to read policy notes before every meeting. At the same time, the dashboard should not ask for blind faith. It should show enough context for people to understand what kind of revenue they are seeing and whether the number is final, provisional, adjusted, or still moving.
The best revenue dashboards tend to answer a few quiet questions inside the design. Is this booked, billed, collected, recognized, gross, net, recurring, or expansion revenue? Which date drives the period? Are refunds and credits included? Is currency converted consistently? Is the latest period closed or still provisional?
Which system owns the number? Who approved the definition? That context can live in labels, notes, definitions, certified models, dashboard tabs, or linked documentation. It does not need to crowd the page, but it needs to be available where people use the number.
This is where many companies can improve quickly. They do not need to rebuild the entire reporting estate. They need to stop broad labels from hiding important differences. A card that says Recognized Revenue is safer than one that says Revenue when the audience is finance or leadership.
A chart that separates Gross Sales from Net Revenue is more useful than one blended growth line. A dashboard that marks the current month as provisional prevents users from treating an unfinished number as a settled fact. Small naming choices can prevent large arguments.
AI does not fix a weak revenue definition. It can make the weakness travel faster. If an internal assistant is connected to dashboards, spreadsheets, documents, and CRM data, it may answer a question like “How much revenue did we make this quarter?” with confidence even when the company has several valid revenue views. The answer may be fluent, fast, and wrong for the decision being made.
This is the next risk for revenue analytics. A human analyst might pause and ask whether the user wants bookings, recognized revenue, cash collected, recurring revenue, or net revenue after refunds. A poorly grounded AI workflow may not pause at all. It may choose a source, produce a summary, and send the wrong revenue story into a leadership note, Slack update, forecast explanation, or board-prep document.
The companies that benefit from AI in analytics will be the ones that have already done the less glamorous work around definitions, owners, trusted sources, period logic, exclusions, and change history. AI can help people ask better questions and move faster through analysis, but it should not be allowed to invent the meaning of revenue on the fly. If the dashboard is too loose for a CFO review, it is too loose for an AI-generated answer.
A dashboard that shows the wrong revenue does more than misstate one figure. It weakens the company’s sense of reality. Revenue is the number people use to decide whether growth is real, whether campaigns are working, whether sales is performing, whether hiring is justified, whether costs are under control, whether customers are expanding, and whether leadership can trust the plan. When that number is wrong, the argument spreads because every team reads its own future from it.
The solution is not to make every revenue dashboard slower, heavier, or more technical. The solution is to make the meaning unmistakable. Sales can look at bookings when it wants to understand momentum. Finance can look at recognized revenue when it needs a period view.
Cash planning can look at collections. Marketing can look at net revenue by channel when it wants to judge quality. Leadership can compare the views without pretending they are the same number.
That is the standard a revenue dashboard has to meet. It should help the company see performance without confusing momentum with money earned, invoices with cash, gross sales with net economics, or early signals with final results. When the revenue language is clear, the dashboard becomes a place where the business can think. When the language is loose, the dashboard becomes one more polished screen that people learn to question.
A wrong revenue dashboard is dangerous because revenue sits at the centre of many business decisions. Leadership uses it for growth discussions, finance uses it for forecasts, sales uses it for performance, marketing uses it for ROI, and operations may use it for staffing or capacity. When the revenue number is wrong, the error rarely stays inside one report. It spreads into plans, targets, budgets, and confidence.
The bigger damage is trust. Once people discover that the revenue dashboard cannot be relied on, they start questioning other dashboards as well. The company then drifts back to private spreadsheets, manual reconciliations, and finance-only numbers, which weakens the value of the analytics system.
The most common cause is not a broken chart. It is a weak definition. The dashboard may be showing bookings when users expect recognized revenue, gross sales when users need net revenue, invoice value when users are discussing cash, or closed-won value when finance is looking for period performance.
Other causes include wrong date logic, missing refunds, duplicated orders, currency issues, delayed source data, manual adjustments outside the reporting layer, and inconsistent treatment of discounts, credits, taxes, or cancellations. Revenue is a business concept before it is a dashboard metric, so the reporting logic has to match the decision.
Booked revenue usually reflects the commercial value of a deal when it is signed or closed. It is useful for sales momentum, pipeline conversion, and understanding what the business has won. Recognized revenue is the amount recorded in a period under accounting rules, based on when goods or services are delivered and the company has earned the revenue.
Both numbers can be valid, but they should not be used interchangeably. A sales review may need bookings, while a finance review or board pack may need recognized revenue. A dashboard that simply says revenue can confuse the room if it does not make this distinction clear.
Date logic matters because the same customer transaction can carry several dates. A company may track order date, close date, invoice date, service-start date, payment date, renewal date, refund date, and recognition date. Each one can place the same transaction into a different period.
This is why two revenue dashboards can disagree even when both are technically pulling real data. One may be reading a closed-won date, another may be reading invoice date, and finance may be using recognition date. The dashboard should make the controlling date visible so users know which business question the trend is answering.
They can share a dashboard, but they should not be forced into one flat revenue number. Sales often needs a faster commercial view, such as bookings, renewals, expansion, and closed-won value. Finance needs stricter views around recognition, billing, collections, margin, cash, and reporting periods.
A better setup is to keep the views connected but clearly named. Sales can use bookings for momentum. Finance can use recognized revenue for period reporting. Leadership can compare both when it wants to understand the gap between commercial activity and finance-ready performance.
Refunds and credits can make a revenue dashboard look too optimistic if they are not included properly. An ecommerce dashboard may show strong order revenue before returns land. A subscription business may show expansion before credits, concessions, or downgrades are applied. A services business may show contracted value before scope changes or delayed delivery affect the final economics.
For commercial teams, early revenue signals can still be useful. For leadership and finance, the dashboard needs to show whether the number is gross or net and whether refunds, discounts, credits, cancellations, and taxes are included or excluded.
Finance should usually own the meaning of serious revenue metrics because it understands recognition, cut-off, accruals, credits, refunds, cash, and reporting discipline. Analytics should own the implementation of that meaning in models, dashboards, tests, and documentation. Sales, marketing, customer success, and product can own operational revenue views for their decisions, but those views need clear names and limits.
The mistake is letting each team define revenue privately. Once a revenue number enters leadership reporting, forecasts, incentives, or board discussion, it needs approved meaning and clear ownership.
A good revenue dashboard should show the right revenue type for the decision, such as booked, billed, collected, recognized, gross, net, recurring, expansion, or contraction revenue. It should also make the period logic clear, show whether the latest number is final or provisional, and explain whether refunds, credits, discounts, and currency conversion are included.
The dashboard does not need to overload the page with accounting detail. It needs enough context for users to trust the number and understand what kind of decision it can support.
AI can make wrong revenue reporting worse by summarizing the wrong number faster and more confidently. If an internal AI assistant is connected to several dashboards and tables without clear definitions, it may answer a revenue question using bookings when the user needed recognized revenue, or gross sales when the user needed net revenue.
That is why AI needs governed revenue definitions, trusted sources, approved metric names, and clear ownership. AI can help users ask better questions, but it should not decide the meaning of revenue by itself.
Start by naming the revenue type the dashboard is supposed to show. Then check the source system, date logic, exclusions, refunds, credits, discounts, currency handling, duplicate treatment, and whether the latest period is final or provisional. Finance and analytics should review the definition together before the dashboard is used again for serious decisions.
The fastest repair is often better labelling and ownership, not a full rebuild. A card that says booked revenue, recognized revenue, or net revenue is already safer than one vague revenue number that everyone interprets differently.
Aug 04, 2026 / 27 min read
Jul 31, 2026 / 24 min read
Jul 31, 2026 / 25 min read