Why Marketing, Sales, And Finance Reports Do Not Match
Aug 04, 2026 / 27 min read
July 31, 2026 / 25 min read / by Team VE
A practical business guide to finding why reports are not trusted, where numbers break, and what has to change before dashboards, BI tools, and AI outputs can support better decisions.
An analytics or reporting audit is not a hunt for broken charts. It is a way to understand whether the company can trust the numbers that shape decisions. The audit should follow important metrics from the source system to the dashboard, meeting, spreadsheet, forecast, board pack, or AI answer where people actually use them.
It should reveal whether the metric definition is clear, whether the source is reliable, whether transformations are documented, whether manual adjustments are visible, whether access is appropriate, and whether someone owns the fix when the number is challenged.
The most useful audit does not try to inspect every field with equal intensity. It starts with the reports that carry business weight: revenue, pipeline, margin, churn, customer health, utilization, cash, inventory, marketing performance, and operational risk. From there, it separates harmless mess from decision risk.
A stale dashboard used by no one is clutter. A stale revenue report used in forecasting is a business problem. A good audit leaves the company with fewer private spreadsheets, clearer metric ownership, cleaner reporting logic, and a reporting system people can question without losing trust in it.
An analytics or reporting system audit is a structured review of the way business data moves from source systems into reports, dashboards, models, spreadsheets, and decision routines. It looks at the full chain: the business question, the metric definition, the source data, the transformation logic, the dashboard design, the ownership model, the access rules, the refresh rhythm, and the way people actually use the output.
In business language, the audit asks a simple question. Can the company explain where this number came from, what it means, who owns it, how current it is, what was changed on the way, and whether it is reliable enough for the decision attached to it? When the answer is unclear, the audit has found the part of the reporting system that needs attention.
A reporting audit usually starts with a human moment, not a technical one. Someone opens a dashboard in a review and the room hesitates. The sales number does not match the forecast file. The revenue number does not feel aligned with finance close.
The churn report shows improvement, but customer success is already worried about renewals. Nobody may know exactly where the number broke, yet the conversation has already changed. People are no longer discussing performance. They are discussing whether the reporting system deserves trust.
That is why an audit has to begin with the numbers that create the most tension. Citigroup is an extreme example from a regulated industry, but the lesson is useful for any company. The OCC’s 2020 action against Citibank cited deficiencies in data governance and internal controls, and later regulators again pointed to insufficient progress around data-quality and regulatory-reporting concerns.
A bank’s reporting environment is far more complex than most businesses, but the underlying principle is familiar. When decisions depend on numbers, weak control around data and reporting becomes an operating risk, not just an analytics problem.
In ordinary companies, the warning signs are smaller and easier to excuse. A finance team quietly rebuilds numbers at month-end because the dashboard cannot be used as it is. A marketing team exports campaign data before every review because the BI view does not show quality clearly enough.
An operations team trusts a local file because the official report refreshes too late. These habits look practical in the short term, but they are also evidence. They show where the reporting system has stopped carrying the decision on its own.
The audit should treat those habits seriously. The most useful question is not whether the dashboard technically works. It is whether the business still feels the need to recreate, explain, adjust, or defend the number before using it. Every extra private step tells you something about trust.
Many audits go wrong because they begin with a list of dashboards. The team exports every report from Power BI, Tableau, Looker, Excel, CRM, or the data warehouse and tries to classify everything. That can be useful later, but it is a weak place to start because dashboard volume does not tell you which numbers actually matter. A company can have hundreds of reports and only a small set of decision-critical metrics.
A stronger audit starts with the business decisions that depend on reporting. Which numbers appear in leadership reviews, board decks, forecast calls, finance close, sales pipeline meetings, marketing budget moves, renewal-risk discussions, staffing plans, inventory decisions, and customer escalations?
Those are the reports where trust matters most. A rarely opened dashboard may be clutter, but a disputed pipeline number inside a forecast call has real cost because it changes how leadership reads the business.
| Decision Area | Reports To Audit First | Why It Matters |
| Revenue and finance | Revenue, margin, cash, billing, collections, recognized revenue | These numbers affect forecasting, board reporting, budgets, and commercial confidence. |
| Sales and pipeline | Pipeline, qualified opportunity, win rate, ageing deals, forecast coverage | Small definition or stage issues can change planning, hiring, and target discussions. |
| Marketing | Lead quality, CAC, channel performance, campaign influence, conversion | Volume without quality can make spend decisions look better than they are. |
| Customer success | Churn, renewal risk, customer health, support burden, expansion | Late or weak signals can hide revenue risk until the account is already in trouble. |
| Operations | Utilization, capacity, backlog, SLA, inventory, delivery performance | Reporting delays here can turn into staffing, cost, and service problems. |
This keeps the audit grounded. The aim is not to prove that every report is perfect. The aim is to find where the reporting system touches money, risk, customers, capacity, or leadership judgement, and then ask whether those numbers are strong enough for the decisions they support.
The cleanest audit move is to take one important number and follow it backward. Pick a metric people already argue about, such as revenue, pipeline, churn, margin, qualified leads, utilization, or customer health. Start where the number is used, then move back through the dashboard, the model, the transformation, the source table, the original system, and the business event that created the data. The point is to see whether the number still means the same thing at each step.
Uber’s own engineering work shows why this chain matters at scale. In its write-up on operational excellence in the data-quality experience, Uber describes supporting more than 2,000 critical datasets and using lineage, ownership, monitoring, and quality checks to detect around 90 percent of data-quality incidents on the platform.
Most companies will never operate at Uber’s scale, but the audit lesson is practical. If a metric is important, the company should know which upstream assets feed it, who owns them, and where a change would be noticed before users discover it inside a meeting.
This is where many reporting systems reveal their real weakness. The dashboard may have a clean chart, but the lineage is unclear. The formula may be known, but the source field is filled inconsistently. The warehouse table may be stable, but a CRM workflow change has altered the meaning of a stage.
A finance adjustment may be correct, but it sits outside the governed reporting logic. An audit should expose these breaks without turning them into a blame exercise. The goal is to make the path of the number visible enough that people can trust it, challenge it, and improve it.
| What To Trace | What The Audit Should Find |
| Business event | What real-world activity created the data in the first place. |
| Source system | Which system is authoritative and whether people actually use it consistently. |
| Transformation logic | How the raw data is cleaned, joined, filtered, calculated, or grouped. |
| Metric definition | What the number includes, excludes, and uses as its date or period logic. |
| Dashboard or report | Where the number appears and whether the same logic is reused elsewhere. |
| Business use | Which meeting, decision, team, or workflow depends on the number. |
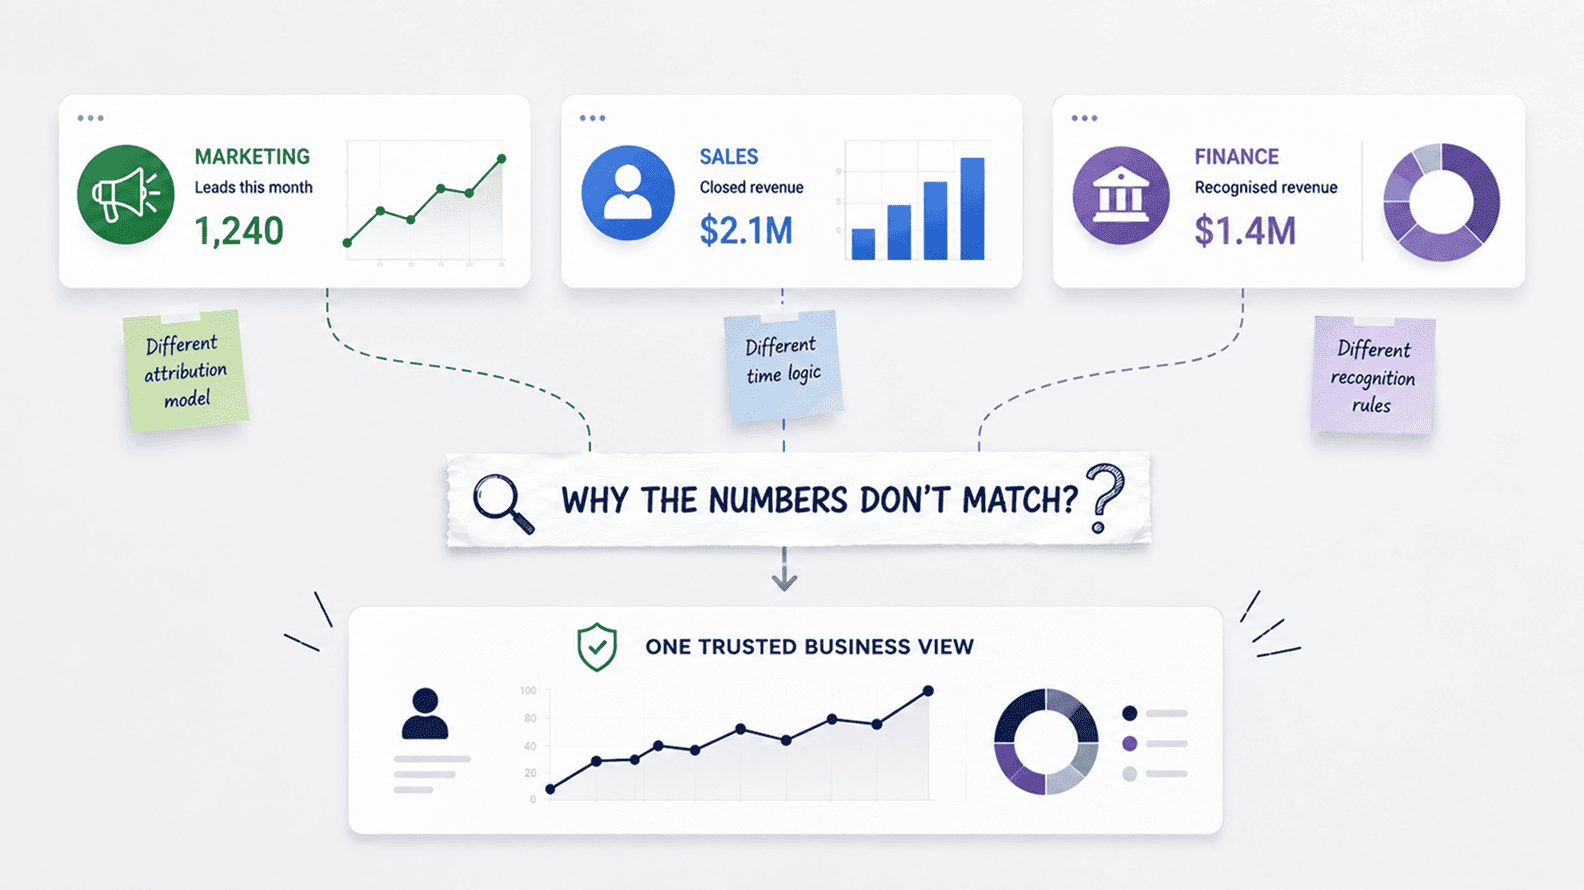
A chart can look wrong because the visual is bad, but many dashboard arguments begin earlier. The metric itself is unclear. One team thinks revenue means bookings, another thinks it means billing, and finance may mean recognized revenue.
One dashboard counts a lead when a form is submitted, while another waits until sales accepts it. A customer may be active because it is using the product, paying invoices, sitting inside a renewal cycle, or simply assigned to an account owner.
An analytics audit should therefore read metric definitions like a business editor, not only like a technical reviewer. Is the metric name precise enough? Is the calculation written in plain language? Does the dashboard show which version of the metric is being used? Are there approved variants? Does the company know which one belongs in which meeting? If the answer is vague, the audit has found a trust issue even before checking the underlying data.
This matters because a reporting system can be technically consistent and still commercially confusing. The same calculation may run perfectly across dashboards, but it may still answer the wrong question for the room. A sales coaching dashboard and a finance forecast may both use pipeline, but they do not need the same version of pipeline.
The audit should not flatten every metric into one universal number. It should make sure every important version is named, owned, and used in the right place.
The simplest audit evidence is the language people use when they challenge a report. If users keep asking what counts, which date is used, whether internal records are excluded, whether refunds are removed, whether stale deals remain, or why the finance version differs, the definition is not doing enough work. A good audit turns those repeated questions into a cleaner metric record.
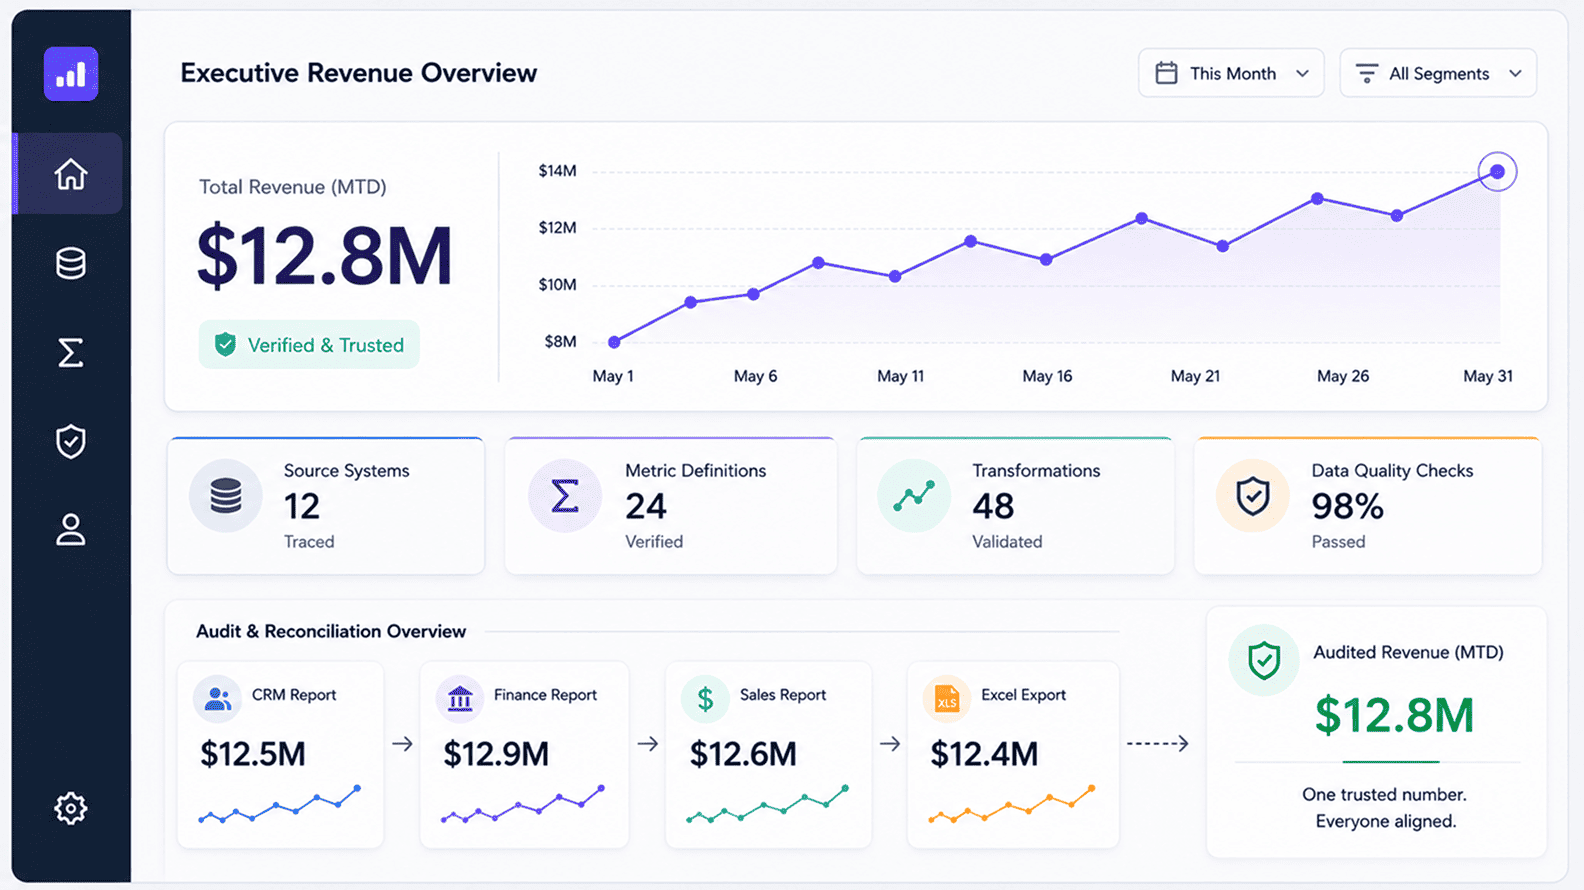
The most honest evidence in a reporting audit often sits outside the BI tool. It is the spreadsheet someone updates every Friday because the official dashboard is missing the final view. It is the finance bridge file that reconciles the dashboard to the close.
It is the sales operations export that leadership trusts more than the report. It is the analyst’s notebook, the manual adjustment, the hidden filter, the Slack explanation, and the screenshot that keeps travelling after the dashboard itself is ignored.
These workarounds should not be dismissed as bad habits. Many exist because the official system did not answer the business question well enough. People created a local version because they had to get through a meeting, defend a forecast, explain a customer risk, or close a month. The audit should ask why those workarounds exist and which of them have quietly become the real reporting layer.
Box’s move to strengthen discovery, lineage, governance, and metadata through Dataplex is a useful example of the opposite instinct. Box described using a central catalog and standardized metadata to make analytics assets easier to discover and trust across complex use cases.
That matters because reporting systems decay when people cannot find the trusted asset, cannot see how it is connected, or cannot tell whether the dashboard in front of them is still the right one.
A good audit pays attention to friction. Where do people export? Where do they reconcile? Where do they keep a private version? Where do they ask the same person for the same number? These are not side issues. They are maps of where the reporting system has failed to meet the business in the way the business actually works.
Once the audit has identified the important reports, the review can become more practical. Most reporting systems break trust in a few familiar places: source quality, definition drift, refresh delays, manual changes, access confusion, old dashboards, and weak ownership. The audit does not need to turn every one of these into a giant remediation programme. It needs to identify which failures are touching important decisions.
| Audit Area | What To Look For | What It Usually Means |
| Source data | Missing fields, duplicated records, weak IDs, inconsistent stage or category values | The report may be calculating correctly from data that is not fit for the decision. |
| Metric logic | Different formulas, date fields, exclusions, denominators, or filters for the same label | Teams may be arguing over definitions while thinking they are arguing over performance. |
| Freshness | Late refreshes, unclear cut-off times, provisional data shown as final | Users may stop trusting the number because timing is not visible. |
| Manual adjustments | Excel bridges, one-off corrections, private calculations, offline finance logic | The official dashboard may be incomplete or not trusted for final use. |
| Access and security | Overbroad permissions, missing row-level control, sensitive fields exposed unnecessarily | The reporting system may create business or compliance risk. |
| Dashboard estate | Duplicates, old versions, abandoned reports, unclear certification | Users may choose the wrong report because the official one is not obvious. |
This is where the audit should stay commercially sharp. A duplicate field inside an unused dashboard is not the same as a duplicate customer record inside churn reporting. A refresh delay in an exploratory report is not the same as a refresh delay in a cash dashboard used by finance. Risk depends on use. The more important the decision, the stronger the quality bar has to be.
Many analytics audits produce a long list of findings and very little change. The reason is usually ownership. The audit discovers that lead source is unreliable, but nobody owns campaign naming across teams. It finds that pipeline definitions differ, but sales, marketing, and finance have not agreed which version belongs where.
It finds that a dashboard is stale, but the business owner who originally asked for it has moved on. The finding is real, but it has nowhere to go.
A reporting system needs different kinds of ownership. The business owner protects meaning and usage. Analytics protects implementation and consistency. Data engineering protects movement and reliability. Finance protects stricter reporting numbers where accounting, cash, margin, or board reporting is involved.
Security or compliance protects sensitive access where the report exposes customer, employee, financial, or regulated data. Leadership protects arbitration when a definition affects incentives or cross-functional accountability.
This is not bureaucracy. It is the difference between an issue that gets fixed and an issue that keeps returning in every review. If nobody owns a metric, every meeting becomes a negotiation. If nobody owns a dashboard, every change request becomes local improvisation. If nobody owns the data source, the BI team may keep patching symptoms downstream while the real weakness remains in the system where the data is created.
The audit should therefore name owners in plain business terms. Who can approve a definition change? Who can say whether a dashboard should be certified or retired? Who decides whether a manual adjustment belongs in governed logic? Who signs off when a metric moves into executive reporting? These questions may feel less technical than data profiling, but they decide whether the reporting system improves after the audit is finished.
AI changes the audit conversation because weak reporting logic can now travel faster. A dashboard at least forces someone to look at the chart. An AI assistant can turn the same weak number into a confident sentence, a leadership summary, a Slack answer, or a draft recommendation.
If the underlying metric definition is loose, the source data is stale, or the official dashboard is not obvious, AI does not resolve the problem. It makes the answer sound smoother while the uncertainty remains underneath.
Yelp’s move toward a trust-first discovery layer on OpenMetadata is relevant here because the case describes a catalog problem shaped by duplicates, thin documentation, and the need for trust signals as AI agents became more common inside the company.
That is exactly the audit issue many businesses will face. If humans cannot easily tell which dataset, dashboard, or metric is canonical, an AI system will struggle with the same ambiguity unless the reporting environment gives it stronger context.
The Data Provenance Initiative makes a related point in the AI world. Its large-scale audit of dataset licensing and attribution examined more than 1,800 text datasets and focused on provenance, licensing, and attribution because models inherit risk from the data they are trained or fine-tuned on.
A business analytics system is different, but the audit lesson is similar. Before a company lets AI answer questions about revenue, pipeline, churn, margin, hiring, utilization, or customer health, it needs to know which data and definitions those answers will rely on.
A practical AI-readiness audit for analytics should not begin with the model. It should begin with the reporting system AI will read from. Which dashboards are certified? Which metrics have owners? Which definitions are current? Which sources are approved? Which sensitive fields should never be exposed? Which caveats should travel with the answer? If these are unclear, the company is not ready to automate the interpretation of those numbers.
A good analytics audit should not leave the company with a thick report that nobody opens. It should leave behind a clearer reporting system. The business should know which dashboards matter, which reports are trusted, which numbers need owners, which definitions are approved, which sources are weak, which manual adjustments should move into governed logic, and which old reports should be retired.
The best audit output is practical because it gives teams a better way to work the following week. A finance team should know which revenue view is approved for close and which dashboard is only operational. A sales leader should know which pipeline definition belongs in the forecast.
A marketing team should know whether the lead-quality view is certified enough to guide budget movement. A customer-success team should know whether the health score is safe for renewal planning or still exploratory.
| Audit Output | Why It Matters |
| A short list of decision-critical reports | Keeps attention on the reports that affect money, risk, customers, or leadership decisions. |
| Certified metrics and definitions | Reduces recurring arguments over what the number means. |
| A lineage view for important numbers | Shows how source systems, transformations, and dashboards connect. |
| A manual-workaround log | Reveals where people have built private reporting because the official system is weak. |
| A dashboard retirement list | Removes clutter and reduces the chance that old reports keep circulating. |
| Named owners and change rules | Gives every important finding a route to resolution. |
The audit is successful when the business can use the reporting system with less hesitation. That does not mean every number becomes perfect. It means the important numbers become clearer, better owned, easier to trace, and safer to use.
The best analytics audits do more than expose problems. They help the company understand why trust has weakened and what has to change for people to use numbers with confidence again. That difference matters because a reporting system is not judged only by how many dashboards it contains or how modern the BI stack looks. It is judged by whether people can use its numbers in serious conversations without quietly reopening the same doubts each time.
A useful audit follows the business reality behind the report. It looks at the decision, the metric, the source, the logic, the refresh rhythm, the manual workaround, the owner, and the meeting where the number finally carries weight. When that path is visible, the company can separate harmless clutter from decision risk.
It can see which reports deserve investment, which metrics need clearer names, which dashboards should be retired, and which source problems must be fixed before the next layer of reporting can be trusted.
This is also why the audit has to stay human. The real evidence is often in the way teams behave around the number. Do they trust the official dashboard, or do they keep a side file? Do they talk about performance, or do they restart the definition debate?
Do they use the report to decide, or do they use it only as a first draft before someone produces the real view? These behaviours reveal whether the reporting system is helping the business think or forcing the business to work around it.
A company does not need perfect data before it improves analytics. It needs honesty about which numbers are good enough for which decisions, discipline around the reports that matter most, and ownership strong enough to fix issues where they start. When an audit does that well, it does not simply produce findings. It gives the business a cleaner way to trust its own operating picture.
An analytics or reporting system audit is a review of how business data moves from source systems into reports, dashboards, spreadsheets, models, and decisions. It checks whether important numbers are defined clearly, calculated consistently, refreshed on time, owned properly, and used in the right business context.
The audit is not only about finding broken dashboards. It is about understanding whether the company can trust the reporting system when decisions depend on it.
A good audit follows the journey of a metric from the original business event to the final report. It looks at source quality, transformation logic, dashboard design, manual adjustments, ownership, access, and actual usage. The best audits focus first on reports that affect money, risk, customers, capacity, and leadership judgement.
A company should audit its reporting system when important meetings keep starting with questions about which number is right. Other signs include repeated manual reconciliation, private spreadsheets, duplicated dashboards, unclear metric definitions, old reports still circulating, and users asking analysts to confirm numbers before every review. These are signs that trust has weakened.
An audit is also useful after major business changes. New pricing, new products, CRM changes, finance-rule changes, new regions, acquisitions, tool migrations, and AI rollouts can all put pressure on old reporting logic. The business may still be using familiar dashboard labels, while the definitions underneath no longer match the way the company operates.
Start with the reports that carry decision risk. Revenue, margin, pipeline, churn, cash, utilization, customer health, inventory, campaign performance, and finance-linked reports usually deserve attention before low-use dashboards. These are the numbers that shape forecasts, budgets, hiring, customer action, performance reviews, and leadership confidence.
A dashboard inventory can come later. Beginning with every report often creates a long cleanup exercise without enough business focus. A better first step is to ask which numbers people argue about, which reports appear in leadership meetings, and which spreadsheets people use when they do not trust the official view.
Auditing metric definitions means checking whether the business can explain what a metric means without guessing. The audit should look at the official name, calculation, population, exclusions, date logic, source system, refresh cadence, owner, accepted variants, and change history. If the metric is called revenue, the audit should clarify whether it means bookings, billing, collections, recognized revenue, net revenue, or recurring revenue.
The test is simple. If two teams use the same word and mean different things, the definition needs work. The goal is not to force every team into one number. It is to name each valid version clearly enough that the right metric appears in the right meeting.
Look at the work people do around the dashboard. Private spreadsheets, repeated exports, manual finance bridges, Slack explanations, analyst side files, and recurring reconciliations often reveal the real weakness faster than a dashboard review. People create these workarounds when the official system does not answer the business question well enough.
The audit should treat these workarounds as evidence, not as bad behaviour. Some may be unnecessary duplicates. Others may contain business logic that should be promoted into the official reporting layer. The important question is why the workaround exists and whether the company would lose trust if that private step disappeared.
Data lineage shows how data moves from source systems through transformations into reports, dashboards, and models. It helps the audit answer where a number came from, which tables or jobs changed it, and what upstream issue could affect it. Without lineage, teams often discover problems only after users complain that a number looks wrong.
Lineage is especially important for decision-critical metrics. If revenue, pipeline, churn, or margin moves unexpectedly, the company should be able to see whether the issue came from the source system, a transformation, a filter, a late load, a dashboard calculation, or a manual adjustment. That visibility makes problems easier to fix and easier to explain.
Audit findings need both business and technical owners. The business owner should own the meaning of the metric and the decision it supports. Analytics should own the reporting logic, dashboard implementation, documentation, and testing. Data engineering should own pipelines, transformation reliability, and source movement. Finance should own stricter revenue, margin, cash, and board-reporting numbers.
Without ownership, the same issue keeps returning. A dashboard can be rebuilt, but if nobody owns the definition, the argument will come back. A data-quality alert can be added, but if nobody owns the source behaviour, the problem may keep flowing downstream. Ownership gives each finding a route to resolution.
A data quality audit focuses on whether the data is accurate, complete, consistent, timely, unique, and valid. A reporting audit includes those checks, but it goes further. It asks whether the data has been turned into reliable business reporting and whether users can trust the number inside the decision where it appears.
For example, customer records may pass basic quality checks, but the churn dashboard may still be misleading if the definition is unclear, renewal dates are stale, downgrade logic is missing, or the dashboard is used for a decision it was not designed to support. Reporting audits connect data quality to business use.
AI assistants and analytics copilots can make weak reporting problems travel faster. A dashboard may show a confusing number, but an AI tool can turn that number into a confident answer or recommendation. If the underlying metric definition is unclear, the source data is stale, or the dashboard is not certified, the AI output may sound more certain than the system deserves.
Before using AI to answer business questions, companies should audit the reporting assets AI will rely on. Certified dashboards, clear metric definitions, source ownership, access controls, caveats, and lineage become even more important when answers are generated automatically.
A useful audit should leave the company with a short list of trusted reports, clearer metric definitions, named owners, visible lineage for important numbers, a list of manual workarounds, and a plan to retire or label outdated dashboards. The output should be practical enough for teams to use immediately, not just a long findings document.
The goal is better reporting behaviour. People should know which number to use, where it came from, what it means, how current it is, and who owns it. When that happens, meetings move faster because teams can spend more time discussing what the number means for the business and less time defending where it came from.
Aug 04, 2026 / 27 min read
Aug 04, 2026 / 22 min read
Jul 31, 2026 / 24 min read