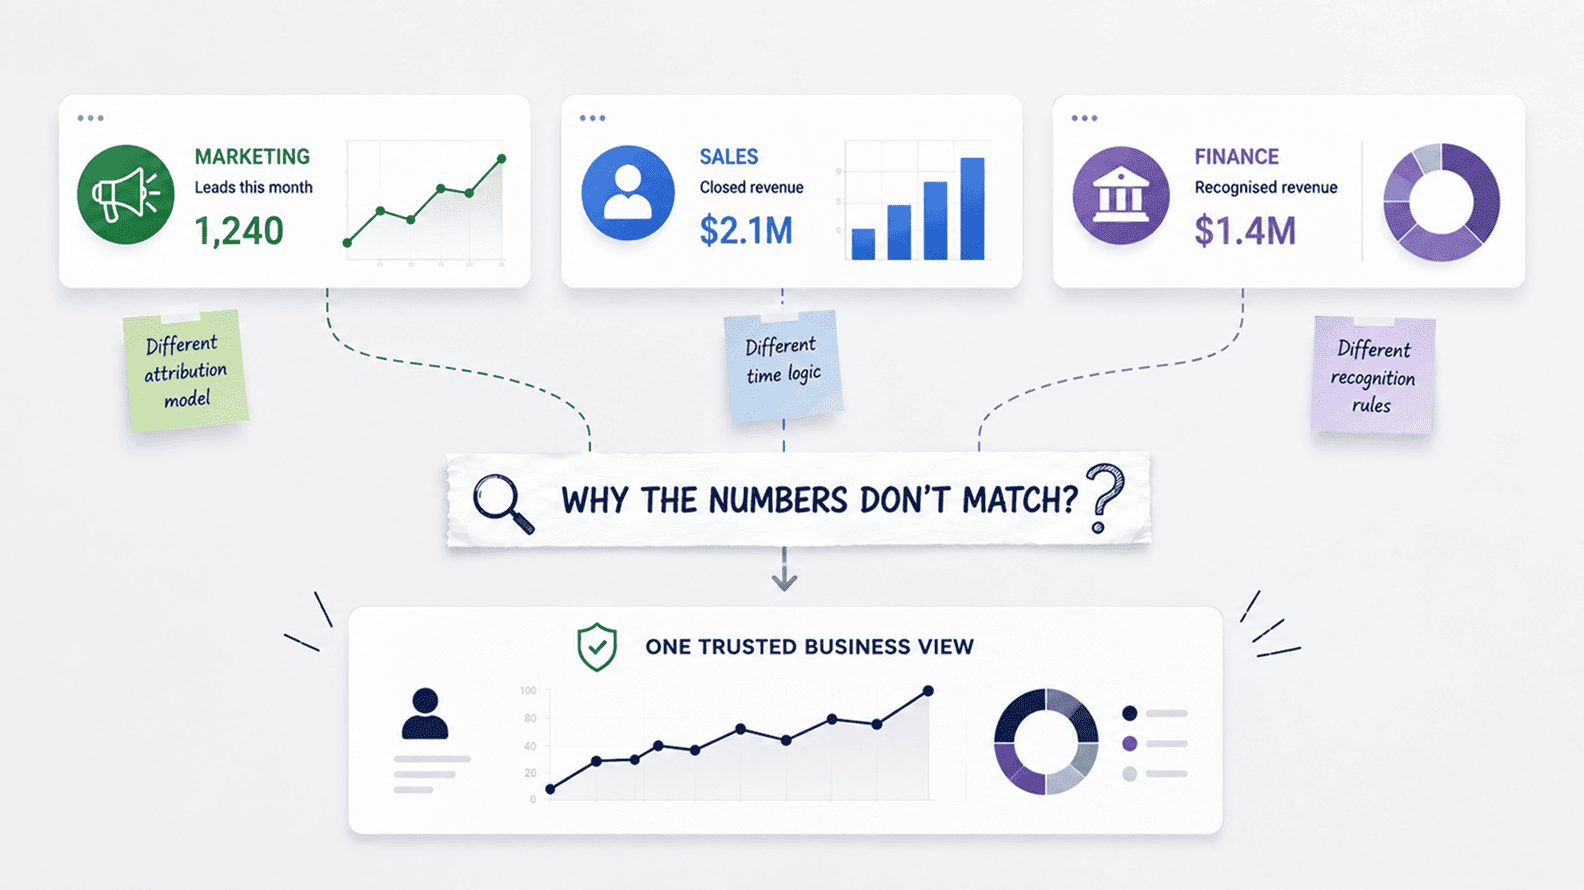
Why Marketing, Sales, And Finance Reports Do Not Match
Aug 04, 2026 / 27 min read
July 31, 2026 / 24 min read / by Team VE
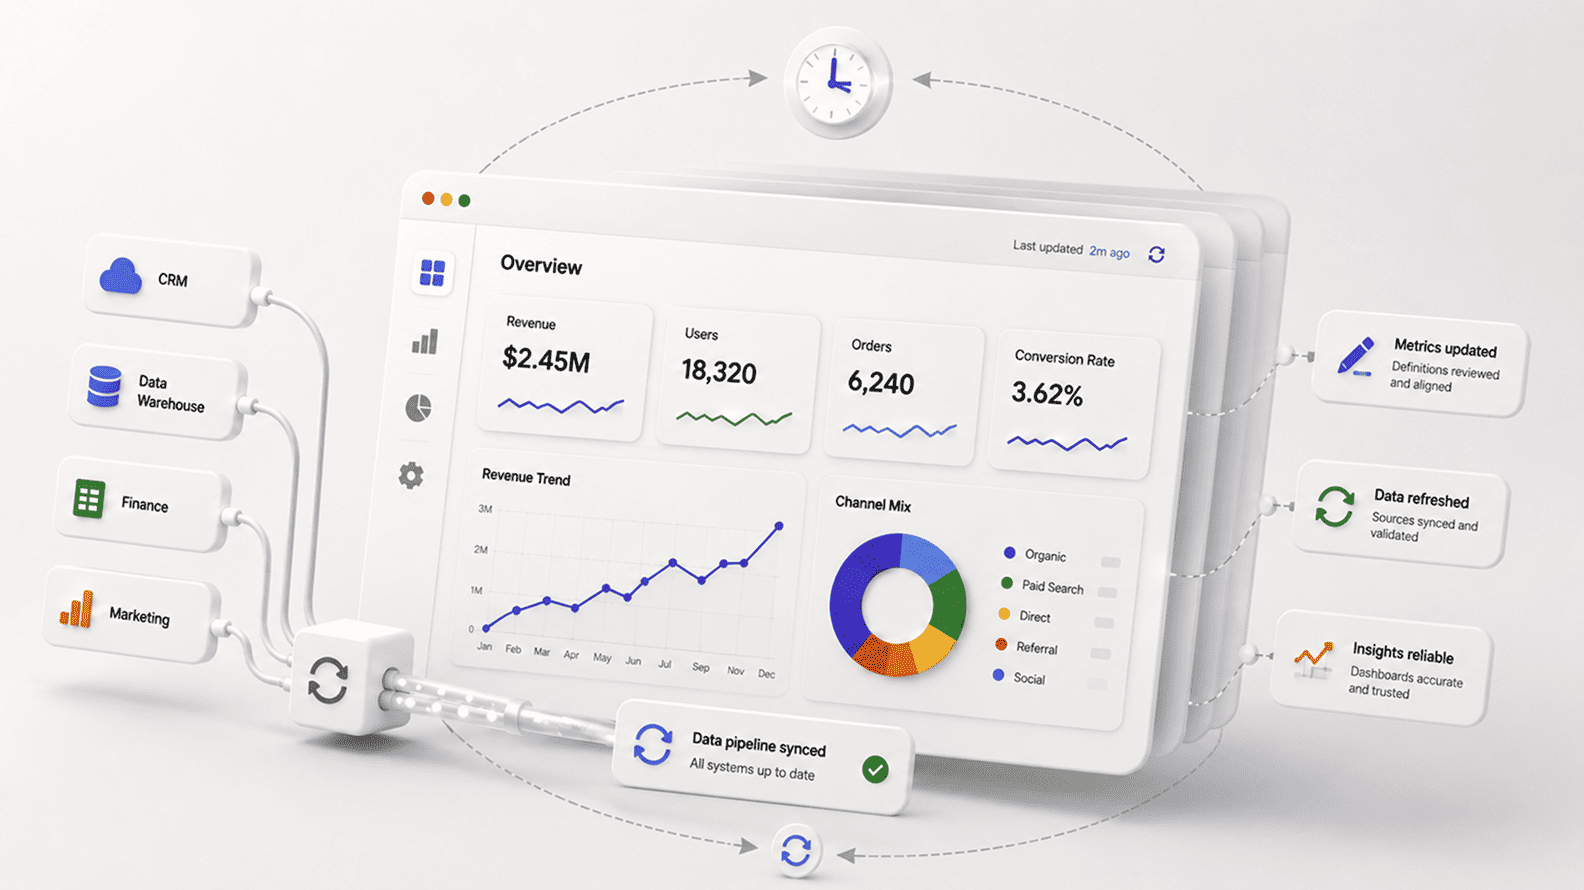
A practical guide to why dashboards, reports, pipelines, metrics, and AI-ready analytics systems lose trust when companies treat them as one-time builds instead of living business assets.
Analytics systems do not stay reliable just because they were built well once. Dashboards, pipelines, reports, metric definitions, permissions, source systems, and business rules all age as the company changes around them.
A sales stage is renamed, a product plan is repackaged, a finance rule changes, a marketing channel is added, a CRM field stops being filled properly, or a dashboard becomes detached from the meeting it was meant to support. Nothing may look broken from the outside, but the system slowly starts answering old questions for a newer business.
Ongoing maintenance is the discipline that keeps analytics useful after launch. It means checking whether data is still arriving on time, whether definitions still match the business, whether dashboards are still used, whether reports have owners, whether old assets should be retired, and whether AI tools are reading from governed and trusted sources.
The goal is not to create more admin around analytics. The goal is to protect the company from decisions built on stale logic, silent data issues, abandoned dashboards, and numbers that people no longer trust.
Analytics system maintenance is the ongoing work of keeping a company’s reporting and analytics environment accurate, trusted, relevant, secure, and useful as the business changes. It covers the health of data pipelines, source connections, metric definitions, dashboards, access rights, documentation, alerting, usage patterns, and the operating habits around important reports.
In plain business language, it is the difference between launching a dashboard and making sure the dashboard still deserves a place in the business six months later. A report can refresh every morning and still be wrong for the current decision. A pipeline can run successfully and still deliver late, duplicated, incomplete, or poorly defined data.
A metric can keep the same name while the business has changed what that metric should mean. Maintenance exists because analytics systems are not static assets. They live inside a moving company.
A good analytics system can look healthy long after it has started drifting away from the business. The pipelines complete. The dashboard refreshes. The finance view opens. The executive report still has familiar charts. That surface stability is exactly what makes the risk easy to miss. The system is working in the narrow technical sense, but the business may have moved on from the assumptions that shaped it.
LinkedIn’s engineering team has written about how its Daily Executive Dashboard grew from a daily leadership dashboard into a system depending on tens of billions of records, more than 50 offline data flows, 40 plus metrics, and later more than 70 online sources.
The story is useful because it shows what happens to successful analytics assets. They do not remain small. The more people rely on them, the more they collect dependencies, delivery expectations, data-quality risks, and performance pressure.
That is the part smaller companies often underestimate. A dashboard built for one sales motion may keep running after the company adds a second one. A campaign report created for paid search may keep being used after partners, marketplaces, events, and affiliate channels enter the mix.
A customer-health view designed around usage may keep appearing in renewal meetings even after pricing, packaging, or service levels have changed. The report still loads, but the business it describes has become harder to read.
Maintenance begins with accepting that analytics has a shelf life unless someone keeps it current. The question is not whether the system was built correctly last quarter. The question is whether it still fits the way the business makes decisions today.
Analytics maintenance is often discussed like a technical problem, but many reporting failures begin with ordinary business change. A company launches a new product bundle, and the old revenue categories no longer explain performance. Sales changes its opportunity stages, and the pipeline dashboard starts mixing old and new behaviour.
Finance adjusts period treatment, and last quarter becomes harder to compare with this quarter. Marketing adds a new channel, and campaign attribution starts carrying exceptions that were never part of the original model.
None of these changes looks dramatic at first. The business is simply evolving. The trouble begins when the analytics layer does not evolve with it. Old labels stay in the dashboard. Old filters stay inside reports. Old definitions remain in meeting packs because nobody wants to reopen the work. Over time, people start treating the official report as a rough guide and fall back on side notes, exports, and private adjustments when a serious decision has to be made.
The maintenance question for leadership is therefore more commercial than technical. When the business changes, which reports are affected? Which metrics need to be renamed, retired, or redefined? Which dashboards are now answering a question nobody asks in the same way anymore? The companies that handle this well make analytics review part of business change, not a cleanup activity that happens months later when the numbers have already lost trust.
| Business Change | What It Can Break In Analytics |
| New pricing or packaging | Revenue categories, margin reporting, ARR, expansion, contraction, and product-level performance. |
| CRM stage changes | Pipeline, conversion, sales velocity, forecast confidence, and qualified opportunity definitions. |
| New marketing channels | Lead source, CAC, attribution, funnel conversion, and campaign quality reporting. |
| New region or segment | Trend comparisons, territory reporting, utilization, churn, and growth analysis. |
| Finance rule or close process change | Period treatment, revenue recognition, cash reporting, board packs, and forecast views. |
| Product event change | Active user, feature adoption, usage health, retention, and customer-risk metrics. |
The data pipeline is usually where people expect maintenance to live, and with good reason. Source systems change fields, APIs behave differently, event names shift, late data arrives after reports have already refreshed, and schema changes can quietly break downstream logic. The dangerous part is that a pipeline can sometimes finish successfully while still delivering data that is late, partial, duplicated, or no longer shaped the way downstream analytics expects.
Uber’s work on its data quality platform is a strong example because the company tied data quality directly to operational outcomes. Uber described how supply and demand data feed real-time systems such as surge pricing, and how lagging or inaccurate data can affect the marketplace.
The company said its consolidated platform supported more than 2,000 critical datasets and detected around 90 percent of data-quality incidents. That is not cleanup after a dashboard complaint. That is analytics treated as production infrastructure.
Most companies do not operate at Uber’s scale, but the principle travels well. If a CRM sync starts arriving late, sales dashboards may look weaker than reality. If refunds enter the warehouse after the revenue dashboard has refreshed, finance may spend the next review explaining a number that was never final.
If a product event is renamed without analytics knowing, usage appears to collapse. Maintenance is the work of noticing those changes early enough that the business does not learn about them from a confused executive review.
Every important metric carries a memory of the business that created it. The first version of churn may have worked when the company sold one product. The first version of pipeline may have worked when every deal followed the same sales process. The first version of utilization may have worked when all employees sat in the same delivery model. As the business grows, that old logic can become too narrow, too broad, or quietly misleading.
This is why metric maintenance is as important as pipeline maintenance. A dashboard may be built on clean data and still mislead if the definition is no longer right for the business. Revenue may need to separate booked, billed, collected, recognized, recurring, expansion, and net views.
Active customers may need to separate product activity from billing status. Churn may need to separate lost logos, lost revenue, downgrades, contraction, and non-renewals. These are not cosmetic changes. They shape planning, accountability, incentives, and leadership confidence.
Good maintenance does not mean rewriting definitions every month. It means paying attention to the moments when definitions are likely to stop fitting. A new product, a new region, a new sales motion, a finance change, a pricing change, or an AI workflow built on top of the metric should trigger a simple question. Does this number still mean what people think it means?
A dashboard can become stale without becoming inaccurate. That is why dashboard maintenance is different from bug fixing. The dashboard may still show the right fields, use the right formulas, and refresh on schedule, but the people it was built for may no longer depend on it. The meeting has changed, the team has changed, the decision has moved elsewhere, or the dashboard now answers a question that used to matter more than it does today.
The easiest way to see this is to look at behaviour. If users keep asking for exports before every review, the dashboard has not replaced the work. If people trust a spreadsheet more than the official report, the dashboard has lost authority. If a dashboard is opened only when someone needs a screenshot, it has become a presentation asset rather than a working asset. If nobody can say what decision the dashboard supports, it is probably living on memory rather than value.
Maintenance should therefore include adoption review, not just refresh checks. Important dashboards need owners who ask whether the report is still used, whether it still belongs in the right meeting, whether it has duplicate versions, and whether the next decision would become harder if the dashboard disappeared. That last question is often the most honest one. If the business would barely notice, the dashboard needs to be improved, merged, or retired.
| Dashboard Symptom | What It Usually Means |
| Users export before every meeting | The dashboard is missing context, flexibility, trust, or the accepted final cut. |
| Several reports show similar numbers | The BI layer has started accumulating duplicates or competing versions of truth. |
| A report is technically correct but rarely opened | The dashboard is no longer close enough to a decision or workflow. |
| Users ask analysts to explain the same number repeatedly | Definitions, caveats, or ownership are not visible enough. |
| Old dashboards keep appearing in search results | Retirement and certification are not being managed seriously. |
The most painful analytics issues are the ones discovered by business users before the data team sees them. LinkedIn’s Data Health Monitor shows what serious monitoring looks like at scale.
LinkedIn described data quality across availability, freshness, schema changes, completeness, nullability, duplication, distributions, and exceptional values, and said the system collected one billion data-health vital signs daily for about 150,000 critical datasets. The useful lesson is that analytics’ health must be observable before trust is damaged in a meeting.
Monitoring also needs judgement. Too many alerts create fatigue, and alerts that arrive without context are easy to ignore. The point is to connect warnings to the business’s meaning of the asset. A late experimental table may not deserve the same attention as a finance feed used in a leadership pack.
A small delay may not matter if the dashboard is used next week, while the same delay may be serious if the report supports a daily operations call. Good maintenance does not treat every report equally. It protects the assets that carry real decision weight.
One reason analytics systems become hard to maintain is that no important report stands by itself. A dashboard may depend on source tables, event streams, transformations, enrichment jobs, semantic models, manual mappings, permissions, and downstream exports.
When one upstream field changes, the visible damage may appear several steps later in a dashboard owned by a different team. Without lineage, everyone spends too much time asking where the number came from and what else might be affected.
Netflix’s engineering team framed this clearly in its work on data lineage. The examples in that piece are very practical: a decision-maker wanting to understand what sits behind a dashboard metric, an engineer changing data consumed by billing or other services, and a platform reliability team trying to identify upstream risks before ETL jobs miss service levels. That is exactly why lineage belongs in maintenance. It gives teams a map of consequences.
For a smaller business, lineage does not need to begin as a large platform project. It can start with the most important reporting assets. Which source feeds the revenue dashboard? Which transformation defines margin?
Which CRM fields support the pipeline report? Which product events feed customer health? Which spreadsheet or manual mapping still sits between the system and the final number? A company cannot maintain what it cannot trace.
Maintenance is not only about definitions and data quality. Analytics systems also need enough performance headroom to survive the moments when the business needs them most.
End-of-month reporting, campaign launches, peak sales periods, finance close, board preparation, and major product changes can all create unusual pressure on data ingestion, processing, and dashboard usage. A system that works on a quiet Tuesday may struggle when everyone needs the numbers at once.
Shopify’s data platform work around Black Friday and Cyber Monday is a useful reminder that analytics reliability is often seasonal and event-driven. In its engineering write-up on scaling the data platform for high volumes, Shopify described its mission as giving merchants, partners, and internal teams fast and reliable access to data, and noted that its platform saw a 150 percent average throughput increase during BFCM.
The company also described a normal monthly scale of about 880 billion MySQL records and 1.75 trillion Kafka messages. The numbers are far beyond most businesses, but the maintenance lesson is familiar. Peak periods expose weak assumptions.
For ordinary companies, this can mean slower dashboards during close, delayed campaign reports during a sale, broken inventory views during a fulfilment spike, or late executive packs during planning season. Maintenance should ask whether critical analytics assets can handle the moments when they are most needed, because trust is shaped as much by reliability under pressure as by accuracy on a normal day.
The most common reason analytics maintenance fails is that everyone benefits from the system, but nobody feels clearly responsible for keeping it useful. When maintenance has no named owner, small issues sit quietly until the next argument forces someone to investigate.
A healthier model gives important analytics assets two kinds of ownership. The business owner protects meaning and use. The technical owner protects implementation and reliability. That split matters because a data engineer should not be left to decide what churn means commercially, and a business owner should not be left to guess how a definition behaves inside a warehouse or dashboard. Maintenance works when both sides stay connected.
This does not need to become bureaucratic. The strongest habit is simply to know who can answer three questions for each important asset. What does this metric mean? Is the data behind it healthy? Does the business still use this report for a real decision? If those questions have no obvious owner, the analytics system is already drifting.
| Maintenance Area | Business Owner Should Care About | Technical Owner Should Care About |
| Metric definition | Meaning, use case, accepted variants, and decision context. | Formula, model logic, tests, documentation, and version history. |
| Pipeline health | Business impact when the data is late, missing, or incomplete. | Freshness, schema, failures, backfills, monitoring, and recovery. |
| Dashboard adoption | Whether the report is still used in the right meeting or workflow. | Performance, access, usability, certified version, and duplicate cleanup. |
| Access and permissions | Who should see the data and which risks matter commercially. | Role controls, auditability, security rules, and source-system permissions. |
| Retirement | Whether the report still supports a live decision. | Deprecation labels, redirects, archive, and removal from search or navigation. |
AI changes the maintenance conversation because it makes analytics easier to query, summarize, and distribute. That is useful only when the underlying system is worth trusting.
If an AI assistant reads from stale dashboards, duplicated reports, weak metric definitions, or poorly maintained sources, it can produce confident answers from the wrong foundation. The issue is not that AI creates every problem. The issue is that AI can move existing analytics problems faster through the company.
A human analyst may notice that revenue could mean bookings in one context and recognized revenue in another. A poorly grounded AI tool may choose one version and explain it fluently. A manager may ask why churn changed and receive an answer based on a dashboard that nobody has reviewed since the pricing model changed.
A sales leader may ask for pipeline risk and get a response built on outdated stage logic. Maintenance becomes more important because AI lowers the effort required to ask questions, while increasing the damage when the answer is built on old assumptions.
This is why AI-ready analytics is really maintenance-ready analytics. The company needs trusted sources, visible definitions, current dashboards, clear ownership, permission controls, lineage, freshness checks, and a habit of retiring old assets. Otherwise AI does not make the business more analytical. It makes the existing confusion easier to reproduce.
Analytics maintenance should be light enough to survive normal work and serious enough to protect important decisions. The mistake is to create a large governance ritual that nobody follows. The better approach is to match the level of maintenance to the business risk of the asset. A board metric, finance dashboard, customer-health model, or sales forecast view needs more discipline than an exploratory report built for one analyst.
A sensible rhythm starts with the assets that people actually use to make decisions. Revenue, pipeline, churn, margin, CAC, utilization, inventory, cash, customer health, and campaign performance deserve a recurring check because they shape budgets, staffing, forecasts, priorities, and incentives.
For each asset, the company should know whether the data is healthy, whether the definition is current, whether the owner is still clear, whether users still rely on it, and whether there are outdated copies creating confusion.
The point is not to inspect every dashboard with equal intensity. The point is to keep the important assets from slowly losing their authority. When maintenance becomes part of the operating rhythm, problems are smaller, fixes are calmer, and trust does not have to be rebuilt from scratch every few months.
| Maintenance Check | What To Ask |
| Data health | Is the data arriving on time, complete enough, and free from obvious breaks or abnormal movement? |
| Metric fit | Does the definition still match the business question and the way leaders use the number? |
| Dashboard use | Is the report still used in a live meeting, workflow, or decision, or has the business moved elsewhere? |
| Duplicate assets | Are there old dashboards, copied reports, or spreadsheets competing with the approved version? |
| Ownership | Can the company quickly identify who owns meaning, implementation, access, and change approval? |
| AI readiness | Would an AI assistant reading this asset receive current, trusted, and permission-safe context? |
Analytics systems lose trust quietly. They do not always collapse in a dramatic outage. More often, they keep running while the business changes around them. The dashboard still opens, the pipeline still completes, and the metric still appears in the review, but people begin adding caveats, checking side files, asking for manual exports, or waiting for someone to confirm the number before they act. That is the moment maintenance has already become overdue.
The strongest companies treat analytics as a living operating system for decisions. They know that data sources change, definitions age, dashboards lose relevance, permissions drift, pipelines slow down, and business questions move. They also know that trust is easier to preserve than to repair. Once leaders start assuming that every number needs a private explanation, even the good reports suffer.
Ongoing maintenance does not make analytics heavier. Done well, it makes analytics calmer. People spend less time reconciling numbers, less time defending dashboards, and less time rediscovering old assumptions. The business can move from checking whether the number is usable to discussing what the number means. That is the real value of maintenance. It keeps analytics close enough to the business that people can still use it to decide with confidence.
Analytics systems need maintenance because the business does not stand still after the first dashboard is built. Source systems change, fields get renamed, sales stages move, finance logic is updated, new products appear, and old dashboards stop matching the way people make decisions. A report can keep refreshing while the meaning behind it has become stale.
Maintenance keeps the analytics layer close to the current business. It checks whether data is still arriving properly, whether metrics still mean what users think they mean, whether dashboards are still used, and whether old reports are creating confusion. Without that, trust slowly moves away from the official system and back into spreadsheets, side conversations, and manual checks.
Analytics maintenance includes data pipeline monitoring, dashboard review, metric-definition updates, documentation, access control, duplicate-report cleanup, performance checks, data-quality testing, source-system change review, and user-adoption checks. The exact scope depends on the maturity of the company and the importance of the reports involved.
The most important point is that maintenance is not only a technical task. A pipeline may need engineering attention, but a metric definition may need finance or sales leadership. A dashboard may need design improvement, but it may also need a clearer business owner. Good maintenance connects technical reliability with business relevance.
High-value dashboards should be reviewed whenever the business process behind them changes, and also on a recurring rhythm that matches their importance. A dashboard used in weekly sales forecasting, finance close, customer health, or executive reporting deserves more frequent attention than an exploratory dashboard used by one team.
The review does not need to be heavy. The owner should ask whether the dashboard is still used, whether the definitions are current, whether the data is trusted, whether duplicate versions exist, and whether the report still supports a live decision. If users no longer depend on it, the dashboard should be improved, merged, labelled, or retired.
A stale analytics system often shows up through behaviour before it shows up through errors. Users ask for exports before every review. Teams trust private spreadsheets more than official dashboards. Analysts keep explaining the same metric caveats. Different dashboards show similar numbers with different totals. Old reports keep appearing in search results. Leaders ask which number is right before they ask what the number means.
These signs usually mean the system has drifted away from the way the business works today. The fix is not always a rebuild. Sometimes the right move is to clarify ownership, update definitions, retire old dashboards, add freshness checks, or bring a recurring manual adjustment into governed logic.
Analytics maintenance should have shared ownership. Business owners should own meaning, use cases, accepted definitions, and the decision context. Analytics or BI teams should own implementation, dashboard logic, documentation, and usability. Data engineering should own pipeline reliability, transformations, monitoring, and recovery. Finance should own finance-grade definitions such as revenue, margin, cash, and reporting treatment.
The worst model is one where everyone assumes someone else is responsible. Important dashboards and metrics need named owners so that changes, disputes, access issues, and quality problems have somewhere to go.
Data quality is one of the most important parts of analytics maintenance because a stable report can still become unreliable when the data underneath changes. Late data, duplicated records, missing fields, renamed events, schema changes, incorrect values, and incomplete source feeds can all damage a metric even when the formula has not changed.
Maintenance should include practical checks for freshness, completeness, consistency, validity, duplicate records, unusual volume changes, and known business rules. The goal is to catch problems before users discover them inside a leadership meeting or customer decision.
Report retirement matters because old dashboards create noise and confusion. Many companies keep adding dashboards but rarely remove the ones that no longer support a decision. Over time, users find several similar reports, each with slightly different filters, definitions, or dates. That makes the analytics system harder to trust even when the latest report is correct.
Retirement does not always mean deleting immediately. A report can first be labelled as deprecated, redirected to the certified version, archived for reference, or removed from main navigation. The important thing is to stop old reporting assets from quietly competing with the current version of the truth.
AI makes maintenance more important because it can pull answers from analytics systems faster and distribute them more widely. If the underlying dashboards, definitions, permissions, or source data are stale, the AI answer may sound confident while relying on weak context. That can spread confusion faster than a traditional report.
AI-ready analytics needs current definitions, trusted sources, clear ownership, access control, lineage, freshness checks, and retired old assets. Without those basics, AI does not solve the analytics problem. It simply makes the existing problem easier to ask about and easier to repeat.
The best starting point is to focus on the metrics and dashboards that already carry business weight. Revenue, pipeline, churn, margin, CAC, utilization, customer health, inventory, cash, and campaign performance usually deserve attention before low-use reports. Review those assets first for data health, definition fit, ownership, adoption, duplicates, and old versions.
This does not require a giant governance programme. A small monthly review of tier-one assets, plus checks after major business changes, can remove many recurring problems. The point is to make maintenance close enough to normal business rhythm that it actually happens.
An analytics audit is usually a deeper review of the current system. It examines data sources, dashboards, metrics, ownership, quality issues, usage, access, reporting duplication, and gaps. Maintenance is the ongoing habit that follows. The audit tells the company where trust is weak. Maintenance keeps that trust from weakening again.
A company may run an audit when dashboards are already messy or when leaders no longer trust reporting. After that, the maintenance rhythm should prevent the same issues from returning through stale definitions, abandoned dashboards, pipeline surprises, or unmanaged report sprawl.
Aug 04, 2026 / 27 min read
Aug 04, 2026 / 22 min read
Jul 31, 2026 / 25 min read