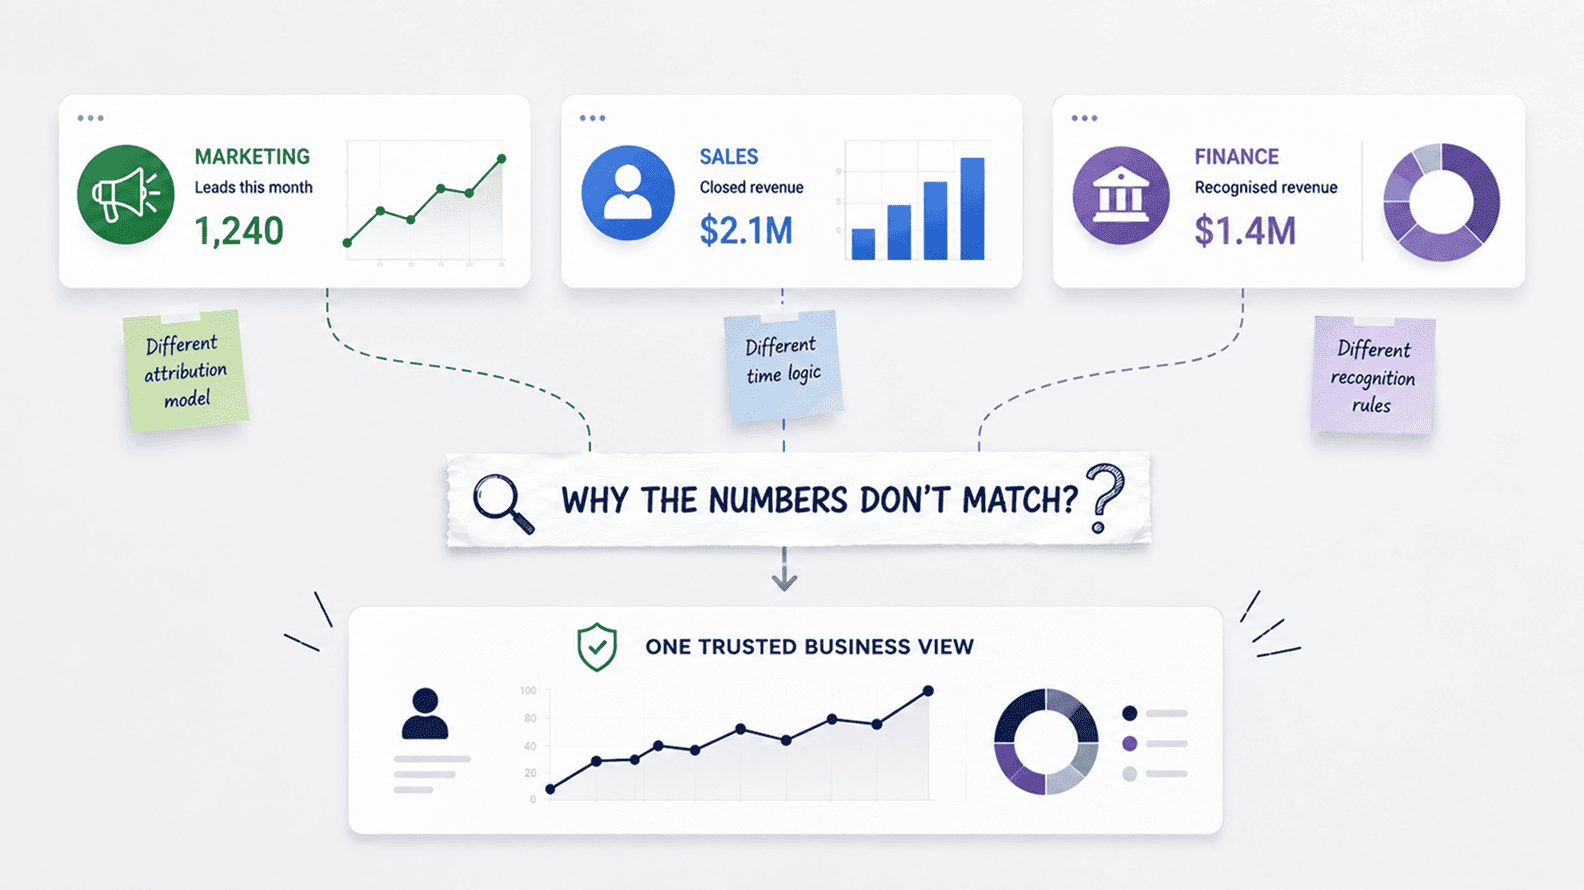
Why Marketing, Sales, And Finance Reports Do Not Match
Aug 04, 2026 / 27 min read
July 24, 2026 / 44 min read / by Team VE
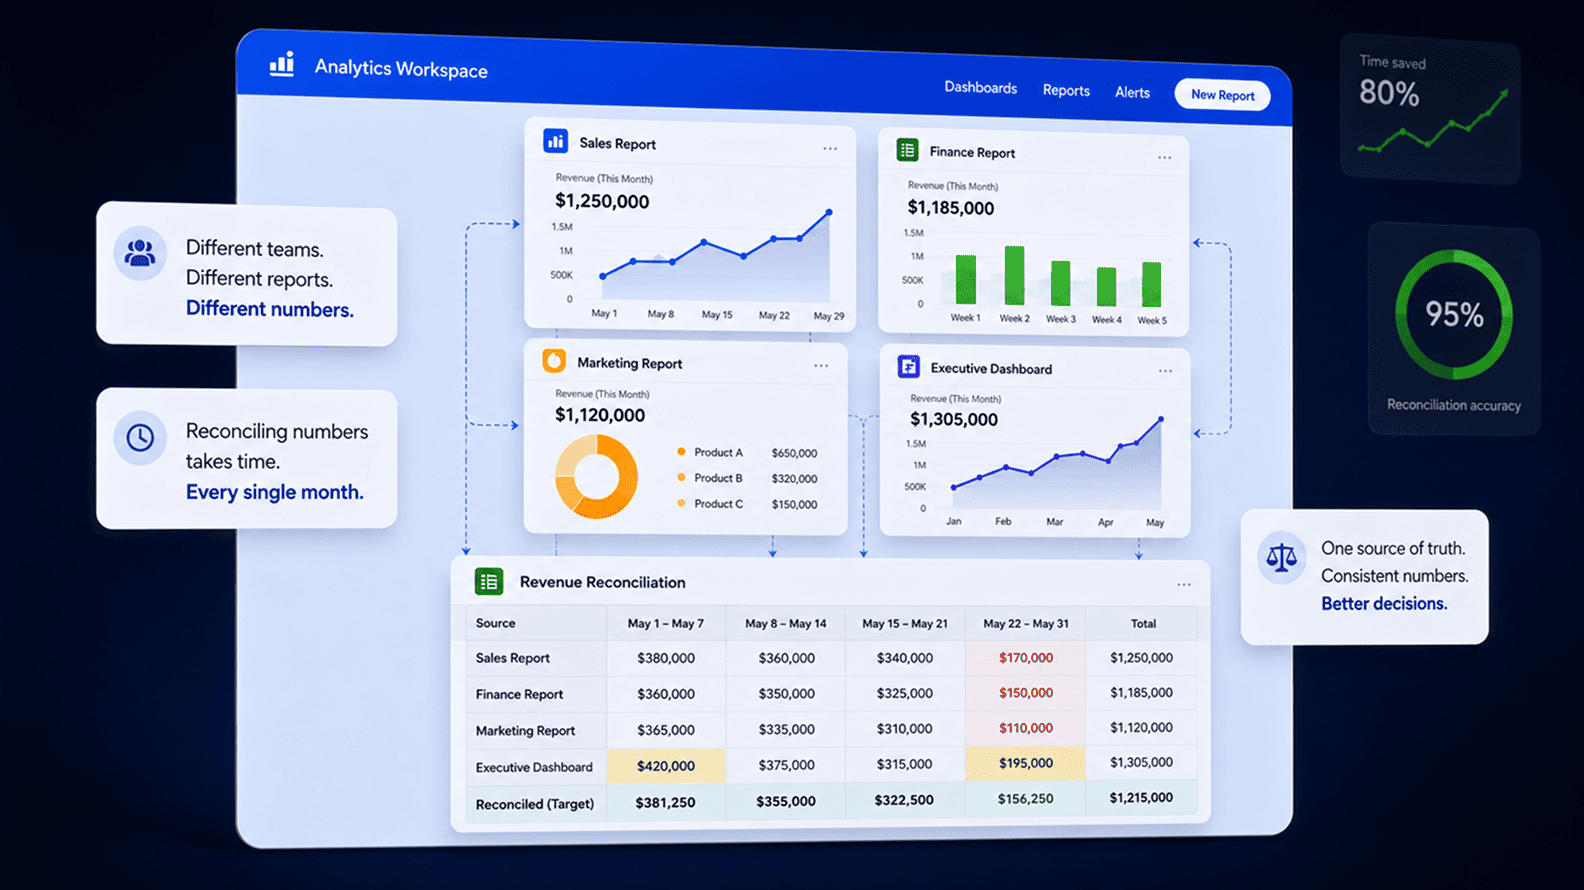
A practical guide for leaders, analytics teams, BI developers, and business users who want consistent metrics, safer self-service reporting, and AI answers that do not invent business meaning.
A semantic layer is the governed business layer between prepared data and the tools that consume that data, including dashboards, spreadsheets, notebooks, applications, and AI assistants. It translates tables, columns, joins, calculations, permissions, and relationships into business concepts such as customer, active account, renewal risk, support SLA, product adoption, qualified pipeline, utilization, and margin.
The need appears when a company has plenty of data infrastructure but no shared language. Teams build dashboards, analysts write SQL, managers export spreadsheets, and the same question returns different answers depending on where it is asked. A semantic layer reduces that drift by giving important metrics and entities approved definitions, owners, grain, access rules, and use cases.
For AI and natural language analytics, the stakes are higher. A human analyst can stop and ask which definition is intended. An AI assistant connected to raw schema may choose a plausible column and answer with confidence. A semantic layer gives AI a governed map of the business instead of a pile of table names.
A semantic layer is a shared, governed business model of data. It defines entities, dimensions, metrics, joins, aggregation rules, permissions, ownership, lineage, and descriptions so that different tools and users can reuse the same meaning instead of rebuilding logic independently.
In 2016, Facebook had to correct the way it reported average video viewing time to advertisers. The metric looked normal, carried an official label, and sat inside a reporting system that advertisers used to judge media performance. But Facebook’s calculation excluded video views shorter than three seconds, and Wired later reported that this made average watch-time figures appear 60 to 80 percent higher than the fuller calculation.
The useful lesson for business teams is not that one large platform made a measurement mistake. It is that a familiar metric can shape real decisions long before users fully understand what the number includes, excludes, or assumes.
Most companies face a quieter version of the same issue. Operations says utilization has improved, but one report counts only billable work while another includes internal productive time. Customer success says active accounts are rising, but product analytics is counting logins while the renewal team cares about accounts using a core feature.
A marketplace team celebrates order growth, while finance asks whether cancelled, refunded, or failed orders were removed before the number reached leadership. Nobody has to be careless for this to happen. The reports differ because the business meaning lives in too many places.
A semantic layer gives that meaning a governed home. If the question is about active customers, the model should know whether the business means paying accounts, logged-in users, accounts with meaningful product usage, customers with open contracts, or accounts eligible for renewal. If the question is about utilization, it should know whether the denominator is scheduled capacity, available hours, billable hours, project allocation, or productive time.
This is why Microsoft describes Power BI semantic models as a logical description of an analytical domain using metrics and business-friendly terminology, and why Snowflake’s semantic views focus on defining business metrics, entities, and relationships rather than leaving every dashboard to rebuild those rules on its own.
A good semantic layer does not make every disagreement disappear, because different teams sometimes need different versions of the same business concept. Finance may need a stricter reporting number, operations may need a live working number, and leadership may need a stable decision number.
The value is that those versions are named, owned, documented, and reused instead of being hidden inside dashboard formulas or personal SQL. When analysts spend hours reconciling reports, when leaders ask for “the real number,” or when AI tools produce confident answers that still need manual checking, the company is usually dealing with a meaning problem before it is dealing with a dashboard problem.
A semantic layer sits between prepared data and the tools people use to ask questions of that data. The warehouse may store the tables, the transformation layer may clean and model them, and the dashboard may show the final chart, but the semantic layer is where the business meaning is made reusable.
It defines the objects people recognize – customers, accounts, orders, claims, campaigns, subscriptions, employees, invoices, products, tickets, territories – and connects them to approved metrics, dimensions, relationships, calculations, permissions, and descriptions.
That is why IBM describes a semantic layer as enterprise data architecture designed to simplify interaction between complex storage systems and business users, because the layer exists to hide technical complexity without hiding the rules that make the number trustworthy.
The practical difference becomes clear in a services business trying to report utilization. One dashboard may calculate utilization from billed hours, another from productive work logged in the timesheet system, another from scheduled capacity, and another from project allocation. Each version may be useful, but only if users know which question it answers.
A semantic layer can define billable utilization, productive utilization, and available capacity as separate approved metrics, each with its own formula, grain, exclusions, owner, and use case. Instead of every BI developer rebuilding the logic inside separate dashboards, the governed definition travels into the reporting layer.
The same principle applies outside services. In insurance, a claim approval rate may depend on whether reopened claims, withdrawn claims, duplicate claims, or pending-review claims are included. In ecommerce, order defect rate may change depending on whether it counts cancellations, refunds, late deliveries, damaged items, or customer complaints.
In healthcare operations, appointment utilization may depend on whether no-shows, rescheduled visits, cancelled slots, and walk-ins are included. A useful semantic layer does not flatten these differences into one vague metric. It names the versions clearly and makes the approved logic available wherever the business consumes data.
Technically, this is why modern semantic-layer tools focus on more than friendly field names. Snowflake’s semantic views define business-facing constructs such as logical tables, dimensions, facts, and metrics, while Cube describes its semantic layer around metrics, dimensions, joins, and access rules that can be defined once and served through multiple interfaces.
Those details matter because the semantic layer is not just a nicer label on top of a database. It is the controlled place where the company decides how business questions should be translated into data queries.
Got it. No repeated Snowflake, no source name repeated from the earlier sections, and no link sitting at the end like a citation dump. Here is the next section only.
Most companies do not wake up one morning and decide they need a semantic layer. The need usually appears after analytics has already become useful enough to spread. A small team starts with a few trusted dashboards, a handful of SQL queries, and analysts who know the business well enough to remember which table is delayed, which status code is old, which field changed after a CRM update, and which metric should never be used in a leadership deck. That arrangement works for a while because the knowledge lives inside a small circle of people.
Growth slowly breaks that arrangement. Finance wants stricter numbers for monthly reporting, sales wants faster pipeline views, marketing wants campaign performance by audience and country, product wants behavioral cohorts, customer success wants account-health signals, and leadership wants one operating view that pulls everything together.
At the same time, the data is being created across more systems than one team can comfortably hold in memory. The 2025 MuleSoft Connectivity Benchmark Report found that organizations use 897 applications on average, while only 29 percent are integrated, which helps explain why even serious analytics teams struggle to keep business meaning consistent once data starts moving across CRM, ERP, billing, product, support, advertising, and finance systems.
The visible symptom is dashboard disagreement, but the hidden cost is analytical drag. Analysts spend time reconciling reports before they can explain performance. BI developers rebuild the same calculation in different dashboards because the approved version is hard to reuse.
Data engineers answer repeated questions about fields that already exist somewhere else. Business users export data into spreadsheets because the official report does not quite match their workflow. Leaders ask for the “final number” outside the dashboard because they no longer know which version has authority.
A semantic layer becomes valuable at this point because it gives repeated business logic a governed place to live. Instead of letting every dashboard decide what an active customer, qualified lead, utilization rate, renewal-risk account, fulfilled order, or claim approval means, the company defines those concepts once with owners, formulas, sources, time logic, permissions, and caveats.
The result is not fewer questions. A healthy business should keep asking better questions. The result is fewer avoidable arguments about the basic language needed to answer them.
A semantic layer is often confused with the things around it because the language in analytics has become crowded. A dashboard can show approved metrics, a glossary can explain business terms, a catalog can help people find data assets, and a BI model can define relationships inside one reporting platform.
All of these can support a semantic layer, but they do not automatically become one. The real difference is whether business meaning is simply being documented for people to read, or whether it is being turned into reusable logic that dashboards, spreadsheets, notebooks, applications, and AI tools can actually use.
A data catalog, for example, is valuable because it helps teams understand what data exists, where it came from, who owns it, and how it moves through the business. Atlan’s explanation of data lineage describes lineage as a way to see how data moves across the data landscape, which is exactly the context teams need when they are trying to understand trust, ownership, and downstream impact.
But lineage by itself does not usually decide how claim approval rate should be calculated, whether inactive suppliers should be excluded from vendor performance, or which utilization metric should be used in a leadership review. It helps explain the journey of data. The semantic layer defines the business rules that should be reused when that data is queried.
| Layer Or Asset | What It Usually Does | Why It Is Not The Same As A Semantic Layer |
| Dashboard | Shows charts, KPIs, filters, tables, and drill-downs for business users. | It consumes business logic, but if formulas live only inside the dashboard, the same metric can be rebuilt differently elsewhere. |
| Data Catalog | Documents data assets, owners, lineage, descriptions, quality notes, and governance context. | It helps people understand what exists, but it does not always make metric logic executable across tools. |
| Business Glossary | Defines business terms such as customer, churn, utilization, claim, order, or qualified lead. | It explains language, but the definition may still need to be manually implemented in every report. |
| Metrics Dictionary | Records KPI names, formulas, owners, descriptions, caveats, and approved use cases. | It is useful for agreement, but a semantic layer goes further by serving those definitions to tools as reusable logic. |
| BI Model | Defines relationships, measures, calculations, and fields inside one BI platform. | It can act as a semantic layer for that platform, but may become tool-specific if other systems cannot reuse the same logic. |
| Semantic Layer | Defines business entities, metrics, dimensions, relationships, grain, permissions, descriptions, and reusable rules. | It turns business meaning into a governed interface that multiple tools can consume consistently. |
The same distinction applies to a metric dictionary. A well-written dictionary can say that “productive utilization” means productive hours divided by available working hours, excluding approved leave and training time. That is useful, but if the rule still has to be rebuilt manually inside Power BI, Tableau, SQL notebooks, spreadsheets, and an AI assistant, the organization has only documented the definition, not operationalized it.
A semantic layer should make the definition executable so the approved calculation, grain, filters, caveats, and permissions travel into the tools where people actually make decisions.
This is why semantic layers should not be treated as another documentation project. Documentation helps people understand meaning, but the semantic layer makes meaning reusable. A dashboard consumes it. A catalog explains the surrounding data estate. A glossary clarifies terms. A metrics dictionary records business agreement.
A BI model may implement part of it inside one reporting environment. The semantic layer earns its place when it becomes the governed business interface that lets different tools ask different questions while still using the same approved logic.
Yes, you are right. If the paragraphs explain every component and the table repeats the same thing, it becomes padded. Better approach: use the prose to explain the idea and business consequence, then use the table as the compact breakdown. The table should carry the details, not repeat them.
Here is the smarter version of that section:
A semantic layer starts becoming useful when it stops behaving like a naming clean-up exercise and starts capturing the choices that shape business interpretation. Renaming customer_id to “Customer ID” may make a field easier to read, but it does not answer the questions that usually break reporting trust. Is the customer a person, a paying account, a workspace, a legal entity, a parent company, or a branch?
Should suspended accounts be counted? Should trial accounts appear in leadership reporting? Should the region follow billing address, sales territory, delivery centre, or account manager assignment?
Those choices are where the real value sits. A business does not lose trust in analytics because a column name looks technical. It loses trust when the same customer is counted differently across finance, sales, product, and support; when one dashboard groups regions one way and another dashboard uses a different hierarchy; when an order count changes because someone joined order-level and order-line data at the wrong grain; or when a utilization metric looks healthy because leave, training, bench time, and billable work were treated inconsistently.
A semantic layer should give those decisions one governed place to live, so the logic can travel into dashboards, spreadsheets, notebooks, embedded tools, and AI systems without being rebuilt from memory.
| Component | What It Defines | Why It Matters In Real Business Use |
| Business Entities | Customers, accounts, claims, orders, employees, tickets, campaigns, subscriptions, suppliers, projects, products, or stores. | Gives teams recognizable business objects instead of forcing every user to understand scattered technical tables. |
| Dimensions | Region, segment, product family, channel, priority, status, plan, team, territory, or project type. | Keeps breakdowns consistent, so “revenue by region” or “tickets by priority” does not change from one dashboard to another. |
| Metrics And Measures | Utilization, active customer, renewal risk, gross margin, claim approval rate, first response time, order defect rate, conversion, or churn. | Prevents critical KPIs from being recalculated differently across reports, spreadsheets, notebooks, and AI queries. |
| Relationships And Joins | How entities connect, such as customers to orders, accounts to users, campaigns to leads, tickets to accounts, or projects to employees. | Reduces duplicated counts, inflated totals, unsafe joins, and misleading roll-ups. |
| Grain And Aggregation Rules | Whether the unit is a user, account, order, order line, invoice, ticket, event, day, employee, project, or subscription month. | Protects users from adding, averaging, or grouping numbers in ways that change the meaning. |
| Permissions And Policy Logic | Who can see, query, export, or reuse specific metrics, fields, and entities. | Keeps sensitive finance, employee, customer, and performance data controlled even when self-service expands. |
| Metadata, Ownership, And Lineage | Descriptions, source context, owners, freshness expectations, caveats, and change history. | Helps users judge whether a number is fit for the decision in front of them. |
The simplest test is whether the semantic layer can carry business meaning without requiring a senior analyst to sit beside every dashboard. If a sales manager explores the pipeline, a finance leader checks margin, an operations head reviews utilization, or an AI assistant answers a natural-language question, the system should already know the approved entities, metrics, joins, grains, permissions, and caveats. That is the difference between a semantic layer that merely labels data and one that makes analytics safer to use.
“Active customer” is one of those metrics that sounds harmless until the business starts using it for serious decisions. Product may count any account where a user logged in during the last 30 days. Customer success may care only about accounts that used a feature tied to renewal value.
Finance may count customers with an active paid contract. Sales may include newly closed accounts that have not yet completed onboarding. Support may think in terms of accounts still eligible for service. Each view can be reasonable, but they should not travel through the company under the same loose label.
This is where a semantic layer becomes practical rather than theoretical. It does not force the business to pretend there is only one definition of an active customer. It separates the definitions and makes their use cases clear. A product team may need “logged-in active accounts” to monitor adoption. Customer success may need “meaningfully active accounts” to spot renewal risk.
Finance may need “paying active accounts” for commercial reporting. Leadership may need one certified version for monthly performance reviews. The value comes from naming those differences properly, assigning ownership, and making sure each dashboard, spreadsheet, or AI tool uses the right version for the question being asked.
| Business Question | Without A Semantic Layer | With A Semantic Layer |
| How many active customers do we have? | The answer depends on whether the report came from product analytics, CRM, billing, support, or a spreadsheet. | Users see clearly named versions such as logged-in active accounts, meaningfully active accounts, and paying active accounts. |
| Which activity counts as active? | A login, page view, product event, support interaction, contract status, or invoice status may be used differently across teams. | The approved definition states the value action, time window, grain, source, exclusions, and owner. |
| Can this metric support renewal decisions? | It may look positive because low-value activity is being counted, even when true product adoption is weak. | Customer success uses a version built around meaningful account activity and known renewal signals. |
| Which date logic applies? | One report may use login date, another may use event date, another may use contract start date or renewal month. | Each version carries its approved time logic, so users know what period the metric actually describes. |
| Can an AI assistant answer safely? | The AI may choose a plausible field such as active_flag or last_login_date without understanding the business question. | The AI can map the question to an approved metric and explain which definition it used. |
The same pattern applies to almost every metric that creates tension in business reviews: utilization, qualified lead, claim approval rate, order defect rate, churn risk, renewal pipeline, margin, ticket backlog, or campaign conversion. The semantic layer does not make the business less nuanced.
It protects that nuance from being lost when numbers move from one tool to another. The goal is not to reduce every term to one universal definition, but to stop different definitions from pretending to be the same metric.
Natural-language analytics changes the risk profile of business reporting because it makes asking questions easier than understanding the answers. A manager can type, “Which customer segment had the highest renewal risk last quarter?” and expect a clean response in seconds. The difficult part is not only converting that sentence into SQL.
The difficult part is knowing what the company means by customer segment, renewal risk, last quarter, active contract, expansion account, churn event, and customer ownership. If those rules are not defined somewhere the system can use, the AI has to infer them from table names, column names, and incomplete context.
That is where the semantic layer becomes a control point for AI, not just a reporting convenience. A human analyst may pause when they see five fields that could all represent revenue, usage, margin, or status. An AI assistant may choose the field that looks most plausible and produce a fluent answer that sounds more certain than it deserves to be.
In a 2026 paper on semantic layers for reliable LLM-powered data analytics, researchers found that adding a compact semantic-layer document improved answer accuracy by 17 to 23 percentage points across three frontier models, which is a useful signal for business teams because the improvement came from better meaning, not from asking the model to be more confident.
This is also visible in how enterprise data platforms are moving. Tableau Semantics is positioned as an AI-infused semantic layer that translates data into business language, while Databricks AI/BI now emphasizes reusable metrics and semantic context for dashboards and natural-language experiences.
The pattern is hard to miss: once business users start asking questions outside traditional dashboards, metric definitions cannot remain trapped inside individual reports. They need to be available to every tool that is expected to answer responsibly.
The business impact is straightforward. AI can make analytics feel faster, but speed without governed meaning can spread wrong answers faster too. A semantic layer does not make AI perfect, and it does not remove the need for validation, review, or judgment.
It does, however, give AI systems a better map of the business before they start answering questions. For companies experimenting with AI reporting, that may be the difference between a useful assistant and a confident shortcut that sends people back to analysts for manual verification.
The commercial case for a semantic layer is not abstract architecture. It is the everyday cost of making skilled people prove the same number again and again. In companies where definitions are scattered, a simple request rarely stays simple.
Before an analyst can explain why renewal risk increased or why utilization fell, they first have to confirm which dashboard is current, which calculation was used, whether the source refreshed, whether the filters match the leadership view, and why another team’s number looks different. By the time the room agrees on the number, the harder business question has already lost momentum.
That cost becomes clearer when the work is repeated across tools and teams. Alteryx’s data-worker research found that data professionals were wasting an average of 14 hours a week because they could not find, protect, or prepare data.
That figure is older, so it should not be treated as a universal benchmark for every company today, but the pattern is still familiar in analytics teams: too much time goes into finding the right input, rebuilding trusted logic, checking whether a number is safe, and explaining why two reports disagree.
A semantic layer reduces that drag by moving repeated business logic into one governed model that dashboards, spreadsheets, notebooks, applications, and AI tools can reuse.
The benefit is easiest to see in companies with heavy reporting spread. AtScale’s Blue Yonder case study says the company consolidated more than 1,000 dashboards and 800 tables into 10 governed semantic models, and reduced one multi-day analyst workflow from roughly 30 hours to about 90 seconds through an AI query connected to governed semantic logic.
Vendor case studies should always be read with context, but the example is useful because it shows the direction of travel: when metric logic is centralized and trusted, the business can spend less time recreating the foundation and more time asking what the number means.
For executives, that means fewer leadership reviews where the first question is whether the KPI is correct. For analysts, it means less reconciliation work and more time for segmentation, diagnosis, forecasting, and decision support. For BI developers, it means fewer duplicated calculations hidden inside dashboards. For data engineers, it reduces demand for one-off reporting tables built only because existing logic is hard to reuse.
For business teams, it makes self-service safer because people can explore governed concepts instead of guessing table names, joins, and formulas. The real gain is not that the company gets a more elegant data stack. The real gain is that the company spends less energy debating the language of performance and more energy improving performance itself.
For analysts, the semantic layer changes the starting point of the job. Without one, even a useful analysis often begins with a quiet investigation into the plumbing: which table is still current, which dashboard used the approved calculation, whether the field name means the same thing after the last CRM change, why finance has a different total, and whether a metric buried in an old report can still be trusted.
That work may look like analysis from the outside, but much of it is really reconstruction. The analyst is rebuilding context before they can even begin answering the business question.
A stronger semantic layer moves that context into the system. The analyst can start from trusted entities and approved metrics instead of rebuilding customer, account, utilization, renewal, conversion, ticket, or product-usage logic from memory. That does not reduce the analyst’s value.
It protects the analyst’s time for the work that actually needs judgment: understanding why a number moved, whether the movement is meaningful, which segment is driving it, whether seasonality or process change is involved, and what the business should do next. The semantic layer removes avoidable confusion so the analyst can spend more time on interpretation.
This matters most when teams are scaling. In a small data team, senior analysts often carry a large amount of undocumented business memory. They know that one source table should be avoided, that one lead-status field was retired, that a region hierarchy changed last quarter, or that a product event includes internal testing activity. New analysts do not have that memory.
BI developers may not have it either. Business users definitely should not be expected to have it. When a semantic layer captures definitions, grain, relationships, caveats, owners, and approved use cases, onboarding becomes easier because the organization is no longer relying only on the few people who remember the history.
It also makes change management less chaotic. If the business updates the definition of a meaningfully active customer, changes how utilization treats training hours, or revises the logic behind renewal risk, the governed metric can be updated, tested, documented, and pushed into the dashboards and tools that consume it.
Without that layer, the same change may sit inside dozens of reports, spreadsheets, SQL snippets, and AI prompts, each one needing manual review. The analyst then becomes the person chasing old logic across the reporting estate, which is exactly the kind of work a mature analytics function should be trying to reduce.
A semantic layer works best when analysts still stay close to the business. It should not turn analysis into button-clicking, and it should not stop people from questioning definitions when the business changes. It simply gives them a cleaner base to question from.
The analyst can challenge whether the approved metric still fits the decision, but they are no longer forced to prove the same formula from scratch every time someone opens a dashboard. That is the difference between analytics as report maintenance and analytics as business thinking.
A semantic layer works best when it is placed after the data has been cleaned and modeled, but before that data reaches the many places where people consume it. That position matters. If it sits too close to raw source data, it inherits every unresolved source-system problem.
If it sits only inside one dashboard, the logic becomes trapped in that dashboard and cannot travel into spreadsheets, notebooks, embedded analytics, operational apps, or AI assistants. The layer needs enough upstream discipline to trust the data underneath it, and enough downstream reach to make business meaning reusable.
Think of a customer-health question. The CRM may hold account ownership and renewal dates, the product database may hold usage events, the support platform may hold ticket history, and the billing system may hold contract status. Data pipelines bring those records into a warehouse or lakehouse. Transformation work resolves account IDs, removes test records, handles history, and creates modeled tables with known grain.
Only after that can the semantic layer define business-facing concepts such as active account, renewal-risk score, product adoption, support intensity, customer segment, and account owner hierarchy. If the upstream account mapping is weak, the semantic layer will not magically fix it. It will simply make the weakness more visible when people start asking questions.
| Stack Layer | Typical Responsibility | What The Semantic Layer Depends On |
| Source Systems | CRM, ERP, billing, product events, support tools, ad platforms, HR systems, finance platforms, and operations tools create the raw business records. | The source fields, events, statuses, and ownership rules must be understood before anyone can define business meaning reliably. |
| Ingestion And Storage | Pipelines move data into a warehouse, lakehouse, or database with defined refresh schedules and reliability expectations. | The semantic layer needs stable, available data sources, because business definitions are only useful if the underlying data arrives properly. |
| Transformation And Modeling | Data is cleaned, joined, standardized, deduplicated, tested, and shaped into facts, dimensions, snapshots, and history-aware models. | Semantic definitions depend on modeled data with clear grain, trusted joins, documented transformations, and quality checks. |
| Semantic Layer | Business entities, metrics, dimensions, relationships, permissions, descriptions, owners, caveats, and reusable logic are defined. | This is where technical structure becomes business meaning that tools can consume consistently. |
| Consumption | Dashboards, reports, spreadsheets, notebooks, embedded analytics, alerts, operational workflows, and AI assistants use the governed model. | Users and tools consume approved definitions rather than rebuilding calculations independently. |
The placement also explains why a semantic layer should not be treated as a repair job for messy data. If product events are poorly instrumented, if customer identity is inconsistent, if CRM stages have no owner, or if finance and operations have never agreed on a definition, the semantic layer cannot solve the disagreement by itself.
It can encode decisions, expose caveats, and make reuse easier, but the organization still has to do the hard work of defining the business process properly.
Once that foundation exists, the semantic layer becomes the point where meaning travels across the stack. A BI developer building a dashboard, an analyst writing a notebook query, a finance user exporting a governed metric, or an AI assistant answering a natural-language question should all be drawing from the same approved model.
That is the real architectural value. The company is no longer relying on every tool to remember the business rules separately. It is giving the rules one governed place to live and making the rest of the analytics environment consume them from there.
A metrics layer and a semantic layer are closely related, which is why the terms often get mixed together. In many teams, the confusion is understandable because the first pain usually appears at the metric level. Revenue does not match.
Churn is calculated differently. Utilization changes depending on the dashboard. Conversion means one thing to marketing and another thing to sales. When that happens, the most urgent need is to standardize the numbers people keep arguing about.
A metrics layer focuses on that specific job. It defines important measures such as active customers, utilization rate, renewal risk, order defect rate, gross margin, first response time, forecast accuracy, claim approval rate, or qualified lead conversion.
It should clarify the formula, source, grain, filters, time logic, owner, and accepted use case for each metric. For many smaller or mid-stage teams, this may be enough to remove a large part of the confusion, especially when most reporting still happens inside one BI tool and the business mainly needs consistent KPI definitions.
A semantic layer is broader because it governs the business model that makes those metrics meaningful. A metric like utilization is not only a formula. It depends on the employee entity, project allocation, billable status, leave records, working calendar, client contract rules, time-entry grain, team hierarchy, and permission rules.
A metric like renewal risk may depend on account structure, product adoption, ticket history, contract dates, payment status, customer segment, and ownership hierarchy. Once those surrounding business objects and relationships are modeled, the organization is no longer only standardizing numbers. It is standardizing the way business concepts connect to each other.
| Question | Metrics Layer | Semantic Layer |
| Main focus | Standardized KPI definitions and calculations. | Business entities, metrics, dimensions, relationships, permissions, and context. |
| Typical use | Keeping important numbers such as churn, margin, utilization, conversion, or active customers consistent. | Creating a governed business model that can support BI, analysis, self-service, embedded reporting, and AI. |
| Best fit | Teams whose biggest issue is repeated KPI disagreement. | Teams where meaning needs to travel across multiple tools, domains, and consumption layers. |
| What it controls | Formula, filters, grain, time logic, and metric ownership. | The wider business logic behind entities, joins, hierarchies, access rules, metadata, and reusable definitions. |
| Practical risk if missing | The same KPI gets rebuilt differently in every report. | Different tools understand the business differently, even if some individual metrics are documented. |
The sensible path is not to debate the labels endlessly. A company should start where the pain is. If the immediate issue is that six dashboards calculate utilization differently, begin by governing utilization and the few related metrics around it.
If the issue is that sales, support, finance, product, and AI tools all need to understand the customer in a consistent way, the work has moved beyond a metrics layer into semantic modeling. The maturity of the layer should follow the complexity of the business, not the fashion of the data-tool market.
The smartest semantic-layer projects usually begin with pain, not architecture. A company does not need to model every table, field, relationship, hierarchy, and dashboard before it gets value. In fact, trying to do that is one of the easiest ways to turn a useful governance idea into a slow internal programme that nobody outside the data team cares about.
The better starting point is the metric or business domain that already wastes time in meetings: utilization, active customer, renewal risk, qualified lead, claim approval rate, support backlog, order defect rate, margin, product adoption, or pipeline coverage.
A focused rollout forces the right conversations early. Take utilization in a services company. Before anyone builds a model, the business needs to decide what kind of utilization it wants to measure. Billable utilization may matter for revenue. Productive utilization may matter for delivery planning. Available capacity may matter for hiring and bench decisions.
Each version needs its own source, formula, grain, exclusions, owner, and allowed use case. Once those definitions are agreed, the data team can model them properly, test them against trusted reports, expose them through the semantic layer, and move the important dashboards onto the governed version. The work feels less like a data architecture exercise because it is solving a real operating problem.
| Step | Main Question | Practical Output |
| Pick A Business Domain | Where does metric confusion already cost time, trust, or money? | A focused area such as utilization, customer health, pipeline, product adoption, finance, support, claims, or operations. |
| Audit Current Logic | How is the same concept calculated today across dashboards, spreadsheets, SQL, and reports? | A comparison of sources, formulas, filters, date fields, owners, exclusions, and known differences. |
| Agree The Meaning | Which definitions are approved, and which decisions should each one support? | Business-owned metric definitions with clear caveats, use cases, and ownership. |
| Model And Test | Can the approved logic be consumed reliably by tools and users? | Semantic entities, metrics, dimensions, joins, permissions, descriptions, tests, and lineage. |
| Move Workflows Onto It | Are people actually using the governed model in daily reporting? | Updated dashboards, retired embedded formulas, training, usage tracking, and change control. |
The adoption step matters more than teams admit. A semantic layer that exists in theory but is ignored by the company’s actual dashboards is just another internal artifact. If the sales dashboard, finance pack, leadership review, AI assistant, and analyst notebooks continue using old embedded formulas, the semantic layer has not changed the business.
It has only created one more place where logic might live. The project becomes real when old formulas are retired, certified reports use the governed model, analysts begin from approved entities, and business users can see which definition is being used.
The common failure patterns are predictable. Teams start too broadly, so the project becomes abstract. Data teams define business meaning without business owners, so users do not trust the result. The model becomes too complex, so analysts bypass it and return to raw SQL. Documentation exists but does not explain caveats in business language.
Definitions change quietly, so people cannot tell whether the number moved because performance changed or because measurement changed. AI consumption is added late, so the model was never designed to give natural-language tools enough context. These are not tool failures. They are operating failures.
A good semantic layer behaves like a product inside the analytics function. It has users, owners, versioning, documentation, testing, adoption targets, and feedback loops. It should start small enough to be useful quickly, but disciplined enough that the first model becomes a pattern others can copy.
The aim is not to build the grandest possible business ontology. The aim is to make the company’s most important numbers easier to trust, easier to reuse, and harder to accidentally redefine.
A semantic layer becomes worth building when the cost of scattered meaning is higher than the effort needed to govern it. A small company with one reporting tool, a few stable KPIs, and a data analyst who understands the whole business may not need a formal semantic-layer programme yet.
A carefully built BI model, a clean metric dictionary, and sensible dashboard ownership may be enough. The need becomes stronger when the same business terms begin travelling across too many tools, teams, and decisions for one person’s memory to hold together.
The clearest signal is repeated disagreement over basic numbers. If leadership keeps asking which customer count is correct, if finance and operations do not trust the same margin view, if product and customer success disagree over active account logic, or if analysts spend the first half of every project reconciling existing reports, the company is already paying the tax of semantic drift.
The same is true when self-service BI is expanding but users still create unsafe joins, rebuild formulas locally, or export data into spreadsheets because the official model does not answer the question in their language.
It is also worth considering when AI or natural-language analytics enters the picture. Before a company lets users ask business questions through an assistant, it needs to know whether its core metrics, entities, dimensions, time logic, and access rules are clear enough for a machine to use.
Without that layer of governed meaning, AI can make the reporting experience feel faster while quietly increasing the risk of wrong answers travelling further. The issue is not whether AI can write SQL. The issue is whether it knows what the business meant by the question.
A practical readiness check looks like this:
| Signal | What It Usually Means |
| Different dashboards show different numbers for the same KPI. | Metric logic is being recreated locally instead of reused from an approved model. |
| Analysts spend too much time reconciling reports before doing analysis. | The team is paying a hidden cost for scattered definitions, sources, and filters. |
| Business users rely on exports and private spreadsheets despite having BI tools. | The official reporting layer is not trusted or flexible enough for daily work. |
| New analysts need weeks to understand which fields, joins, and dashboards are safe. | Too much business meaning lives in personal memory instead of governed systems. |
| Multiple tools consume the same data: BI, spreadsheets, notebooks, apps, and AI assistants. | Definitions need to travel beyond one dashboard or one platform. |
| Leadership wants one trusted operating view. | Core metrics need owners, approved logic, certified sources, and visible caveats. |
| AI analytics is being tested on business data. | The company needs machine-readable business context, not only database schemas. |
A semantic layer is not a trophy for data maturity. It is a response to a specific kind of business pain. When people can no longer trust that the same word means the same thing across reporting, the company needs a governed place where meaning can live.
The strongest analytics teams do not sell this as architecture for its own sake. They sell it as fewer KPI arguments, fewer duplicate formulas, faster analyst onboarding, safer self-service, cleaner AI answers, and more time spent deciding what to do rather than proving what the number means.
The easiest way to weaken a semantic-layer project is to sell it as a technical upgrade. Business teams do not wake up worrying about semantic models, query generation, headless BI, or governed entities. They worry about more practical things: why two dashboards disagree, why an executive number changed overnight, why a new analyst cannot reproduce last month’s report, why self-service BI still creates bad joins, and why an AI assistant gave a confident answer that finance had to correct later.
That is why the semantic layer has to be framed as a trust system. It gives the company a place to decide what important business terms mean, how they should be calculated, who owns them, where they can be used, and how changes should be handled.
Once that exists, the same definition can travel into dashboards, spreadsheets, notebooks, embedded analytics, operational workflows, and AI tools. The business still gets flexibility, but it no longer has to tolerate every tool inventing its own private version of the truth.
The strongest version of this work does not make analytics feel heavier. It makes it feel calmer. A marketing head can look at qualified pipeline without wondering whether sales accepted the same definition. A delivery leader can review utilization without debating whether leave and training were handled consistently.
A customer success team can study active accounts without mixing casual logins with meaningful usage. A finance leader can trust that margin has an owner, a source, and a documented calculation. The conversation moves faster because the language underneath the conversation is no longer unstable.
The semantic layer is becoming more important because the interface for data is changing. Dashboards are still important, but they are no longer the only place where business users meet data. Numbers now appear in automated alerts, board packs, spreadsheets, product screens, customer portals, Slack-style updates, workflow tools, and AI assistants. When data travels into that many surfaces, meaning has to travel with it. Otherwise, every new surface becomes another place where definitions can drift.
The final test is not whether the company can say it has a semantic layer. The test is whether people use governed meaning by default. When someone asks what active customer means, the answer should not depend on who happens to remember the SQL. When someone builds a dashboard, they should start from approved entities and metrics rather than copy an old formula.
When an AI tool answers a business question, it should draw from business definitions, permissions, and caveats, not just table names. A semantic layer matters because it turns data from a collection of records into a shared operating language the company can actually use.
A semantic layer is the part of the analytics setup that translates data into the language of the business. Instead of forcing every analyst, dashboard builder, or AI assistant to work directly with raw table names and hidden joins, it exposes approved concepts such as active customer, utilization, renewal risk, qualified lead, claim approval rate, margin, product adoption, and pipeline coverage.
The practical value is consistency. When different teams ask the same business question through different tools, the answer should not depend on who wrote the SQL, which dashboard they opened, or which spreadsheet they copied last month. A semantic layer gives the company one governed place to define important business meaning and reuse it.
A semantic layer depends on data modeling, but it is not exactly the same thing. A warehouse data model organizes tables, facts, dimensions, relationships, history, and keys so the data can be stored and queried properly. The semantic layer takes that foundation and turns it into business-facing concepts that users and tools can safely consume.
For example, a warehouse may contain account tables, event tables, contract tables, invoice tables, and support-ticket tables. The semantic layer can use those modeled tables to define business concepts such as meaningfully active account, renewal-risk account, active contract, support intensity, or product adoption. The data model gives structure. The semantic layer gives governed business meaning.
A metrics layer focuses mainly on standardizing calculated numbers. It defines metrics such as utilization rate, active customers, churn, order defect rate, first response time, claim approval rate, margin, or qualified lead conversion. It helps stop different reports from rebuilding the same KPI with different formulas.
A semantic layer is broader. It includes metrics, but it also defines the business entities, dimensions, joins, hierarchies, permissions, ownership, descriptions, and caveats that make those metrics usable. A company may start with a metrics layer when KPI disagreement is the main pain. It moves toward a semantic layer when the wider business model needs to travel across BI tools, spreadsheets, notebooks, apps, and AI assistants.
AI analytics makes it easier for business users to ask questions, but it also increases the risk of fast, confident, wrong answers. If an AI assistant is connected to raw data without business context, it may choose the wrong field, join tables at the wrong grain, use the wrong date logic, or ignore exclusions that a human analyst would have checked.
A semantic layer gives AI systems a governed map of the business. It tells the system which metrics are approved, how entities relate, which dimensions are safe, what permissions apply, and which caveats matter. That does not make AI perfect, but it reduces guesswork and gives the answer a better chance of matching the way the company actually measures performance.
Small companies do not always need a full semantic-layer platform. If the company has one reporting tool, a few stable KPIs, and a small team that shares the same definitions, a well-managed BI model and metric dictionary may be enough. The risk is overbuilding before the business has enough complexity to justify it.
The need becomes stronger when basic terms start drifting across teams. If sales, finance, marketing, operations, product, and leadership are using different definitions of the same numbers, or if analysts are spending too much time reconciling reports before they can explain performance, the company needs semantic governance in some form. It can start small, but the discipline needs to begin.
Ownership should be shared between business teams and the data team. The business should own meaning because finance, sales, operations, product, marketing, and customer success understand what their metrics are meant to represent. The data team should own the technical implementation, testing, modeling standards, access controls, documentation, lineage, and reliability.
This split matters because a semantic layer fails when the data team is forced to invent business definitions alone. A utilization metric needs operations input. A renewal-risk metric needs customer success input. A margin metric needs finance input. A qualified-lead metric needs sales and marketing agreement. The data team can make those definitions reliable, but the business has to approve what they mean.
Yes, depending on the architecture and how widely the definitions need to travel. A Power BI semantic model can work well when reporting is centered inside the Microsoft ecosystem. Looker can serve semantic logic through LookML. dbt can centralize metric definitions close to transformation work. Snowflake semantic views can bring business concepts into the data platform. Cube can act as a headless semantic layer for dashboards, applications, and AI use cases.
The real question is not which tool has the strongest label. The better question is where governed meaning should live so the teams and systems that need it will actually use it. A semantic layer that is technically impressive but ignored by daily dashboards and analysis workflows will not solve the trust problem.
Self-service BI often fails when users are given access to data without enough guardrails. They may not know which table to use, which join is safe, which date field matters, whether a metric should be summed or recalculated, or which version of a KPI is approved for leadership reporting. The result is usually a dashboard that looks useful but quietly carries the wrong assumptions.
A semantic layer makes self-service safer by exposing approved business objects instead of raw technical complexity. Users can still explore, filter, and slice the data, but they are doing it through governed entities, metrics, dimensions, relationships, and permissions. Good self-service does not mean removing control. It means building the right control into the experience so people can move faster without creating new versions of the truth.
The biggest mistake is starting too broadly. Teams try to model the entire company, the project becomes slow and abstract, and business users keep using their old dashboards because nothing has changed in their daily work. A better approach is to start with one painful domain where metric disagreement already costs time, trust, or money.
The second mistake is treating the semantic layer as a tool purchase. A platform can store definitions and serve metrics, but it cannot decide what the business means by active customer, utilization, renewal risk, or qualified lead. Adoption also matters. If old embedded formulas remain inside dashboards, spreadsheets, and AI prompts, the semantic layer becomes another place where logic exists rather than the place where trusted logic lives.
A semantic layer is working when governed definitions become the default path for analysis and reporting. Analysts stop rebuilding the same calculations. BI developers build dashboards faster because approved entities and metrics already exist. Business users spend less time asking which number is correct. New analysts onboard faster because the model explains the business logic instead of leaving it inside someone’s memory.
The strongest signal is cultural. When someone asks, “What does this number mean?” the answer should point to a governed definition, not to a person who remembers the SQL. When someone builds a new dashboard, they should begin with approved metrics rather than copying formulas from an old report.
When an AI assistant answers a business question, it should draw from the same business model that dashboards and analysts use. That is when the semantic layer has moved from architecture into daily decision-making.
Aug 04, 2026 / 27 min read
Aug 04, 2026 / 22 min read
Jul 31, 2026 / 24 min read