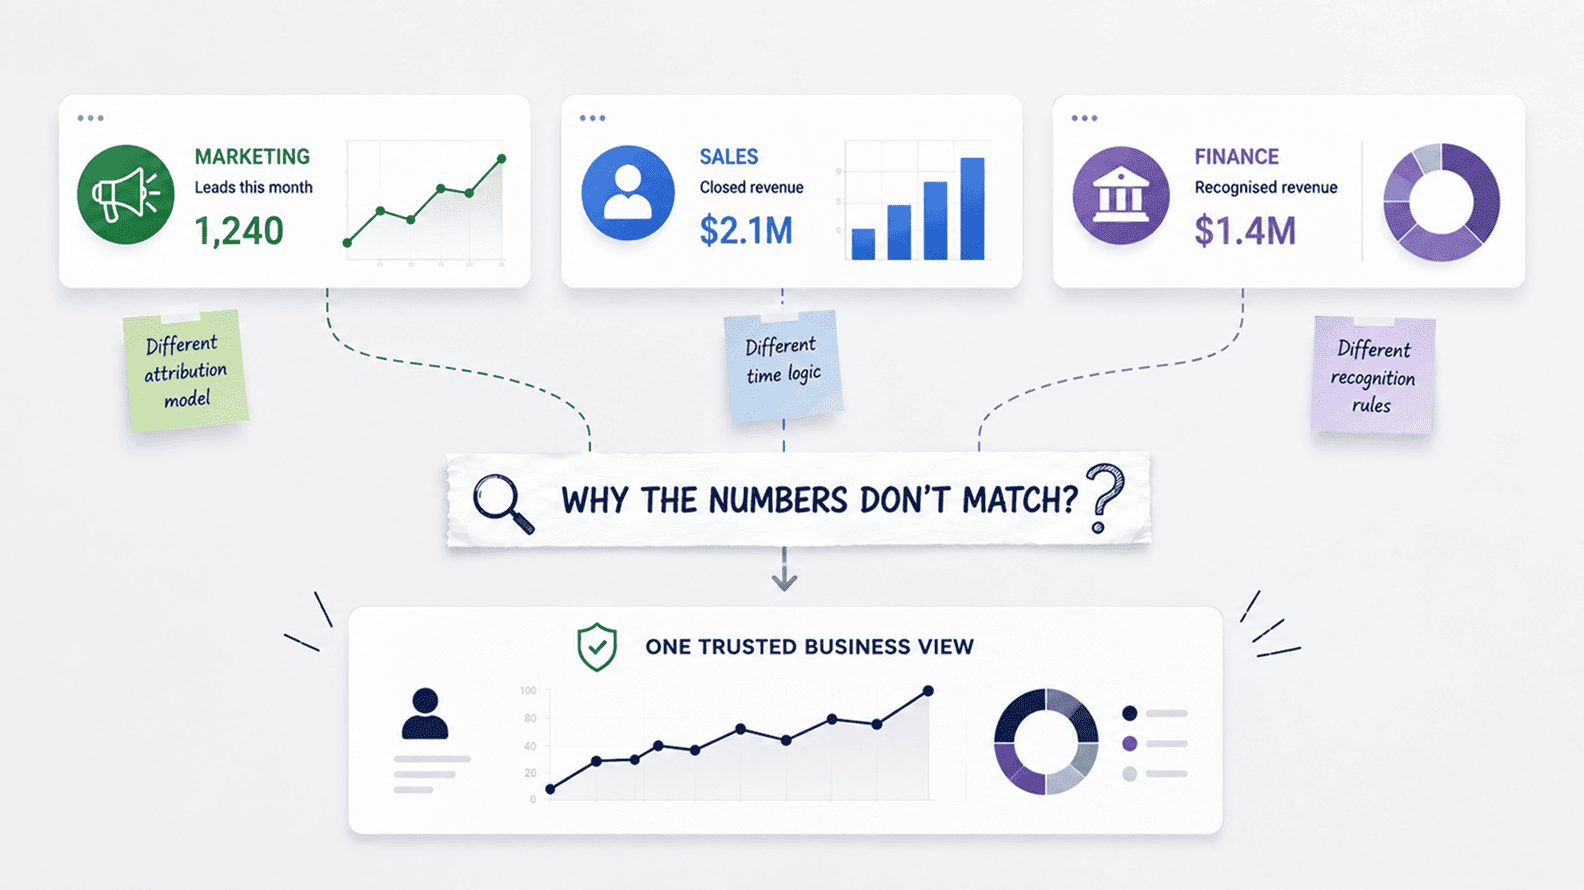
Why Marketing, Sales, And Finance Reports Do Not Match
Aug 04, 2026 / 27 min read
July 31, 2026 / 37 min read / by Team VE

Remote analytics works when it is managed as an operating model, with clear ownership, documented decisions, shared metrics, and a rhythm that lets specialists move fast without becoming a disconnected reporting desk.
Remote data and analytics specialists work best when they are treated as part of the company’s decision system, not as an outside ticket desk. They need access to context, clear priorities, reliable data sources, and the people who understand what the numbers are meant to decide. Without that, even a skilled analyst can end up producing dashboards that look correct but miss the real business question.
The strongest model is simple: internal leaders own the priorities and meaning, while remote specialists handle the analysis, reporting, modelling, documentation, automation, and ongoing dashboard improvement. When this relationship is structured well, companies get more than extra reporting capacity. They get a cleaner rhythm for turning scattered business data into decisions people can trust.
A remote data and analytics specialist is someone who helps a company turn scattered business data into usable reporting, analysis, dashboards, models, and decision support without needing to sit inside the office. The role may sit under data analysis, BI development, analytics engineering, reporting, visualization, or data operations, depending on the company’s setup.
What matters is not the title. What matters is whether the specialist can understand the business question, work with the right data, explain the logic clearly, and produce analysis that people can actually use.
Remote does not mean detached. A remote analytics specialist may sit in another city or country, but the work only becomes valuable when the person is connected to the company’s operating rhythm: its planning meetings, reporting cycles, decision language, source systems, data owners, and business priorities. Without that connection, the company gets reports. With it, the company gets analysis that supports real decisions.
Most business leaders ask the wrong first question when they think about remote analytics. They ask whether a data analyst can work from another location.
The honest answer is yes, because much of analytics already happens through cloud warehouses, BI platforms, shared documents, ticketing tools, version control, CRM exports, finance systems, marketing platforms, and video calls. The analyst rarely needs to sit beside the sales manager to calculate conversion rates or beside the finance controller to reconcile revenue logic.
The better question is whether the company knows how to make analytical work visible, testable, and connected to real decisions. That is why current thinking on hybrid work has moved away from simple office-versus-remote arguments.
McKinsey’s 2025 work on return-to-office policy argues that the working model matters less than the practices that support collaboration, connectivity, innovation, mentorship, and skill development. Analytics follows the same logic. A weak analytics process stays weak in the office. A disciplined analytics process can work across cities and time zones.
The friction begins when companies treat analytics as a set of tasks instead of a shared operating system. A dashboard request may look simple: pull leads by channel, calculate sales pipeline, compare monthly revenue, or show customer churn by segment. Underneath that request sit dozens of assumptions. Which lead source counts when a prospect touches paid search, LinkedIn, and a webinar?
Does pipeline mean open opportunity value, weighted opportunity value, qualified pipeline, or board-approved forecast? Should revenue be booked, billed, collected, recognized, or contracted? Does churn include downgrades? Does margin include delivery cost, software cost, or only direct payroll cost?
An internal analyst can sometimes survive a bad process because they absorb context informally. They overhear the finance debate. They know the sales head changed the stage definition last month. They remember that the marketing dashboard excludes test campaigns. A remote specialist does not get that information by osmosis. The company has to turn hidden context into working context. That is the entire game.
A good remote analytics specialist is not just a dashboard builder. In mature setups, the role sits somewhere between business translator, data investigator, reporting engineer, and decision support partner. The person may start with a request from marketing, sales, finance, operations, HR, customer success, or leadership, then move through a chain of questions that most non-analytics teams underestimate.
Where is the data coming from? Is the source system reliable? Are there duplicate records? Is the date field the created date, closed date, invoice date, payment date, or reporting date? Is the number supposed to match finance or show operational movement? Is the metric meant for daily action, monthly review, board reporting, or a one-off investigation? Should the output be a dashboard, spreadsheet, memo, slide, alert, metric definition, or cleaned dataset?
This is why the role often overlaps with what modern analytics teams call analytics engineering. dbt’s guidance on collaborative analytics engineering describes analytics engineering as work that must balance technical discipline with business context, using shared standards, documentation, testing, version control, and deployment practices.
That description fits remote analytics well because remote work exposes every loose edge in the process. If business logic is undocumented, the remote analyst will feel it first. If source data is unreliable, the dashboard will reveal it. If departments disagree on definitions, the report will become the battlefield.
| Work Type | What the Remote Specialist Does | What Internal Teams Must Provide |
| Ad-hoc analysis | Runs focused analysis to answer a specific business question, usually with a short memo or working file. | The decision being made, the audience, the deadline, and any known business rules. |
| Dashboard development | Builds BI dashboards, defines views, cleans visuals, validates metrics, and documents filters and logic. | Metric definitions, user roles, refresh expectations, approval owners, and feedback from actual users. |
| Reporting automation | Turns recurring manual reports into scheduled datasets, dashboards, alerts, or templates. | Current report samples, pain points, cadence, exceptions, and the person who signs off the final number. |
| Data quality checks | Finds duplicates, missing values, broken joins, stale data, outliers, and source inconsistencies. | Acceptable thresholds, known exceptions, business meaning of errors, and escalation paths. |
| Metric governance support | Documents definitions, flags conflicting logic, and helps align marketing, sales, finance, and operations metrics. | Named metric owners and leadership support when definitions create internal disagreement. |
| Analytics maintenance | Reviews dashboards, refresh jobs, queries, access, usage, and broken dependencies. | Priority rules, user feedback, ownership of legacy reports, and agreement on what should be retired. |
There are three common ways companies work with data and analytics specialists. The first is centralized, where one analytics team serves the whole business. The second is embedded, where analysts sit inside departments such as sales, finance, marketing, or operations.
The third is hybrid, where a central data function sets standards while analysts or specialists work closely with specific business teams. Remote analytics can fit any of these models, but the hybrid model is often the safest for growing companies because it protects both consistency and business intimacy.
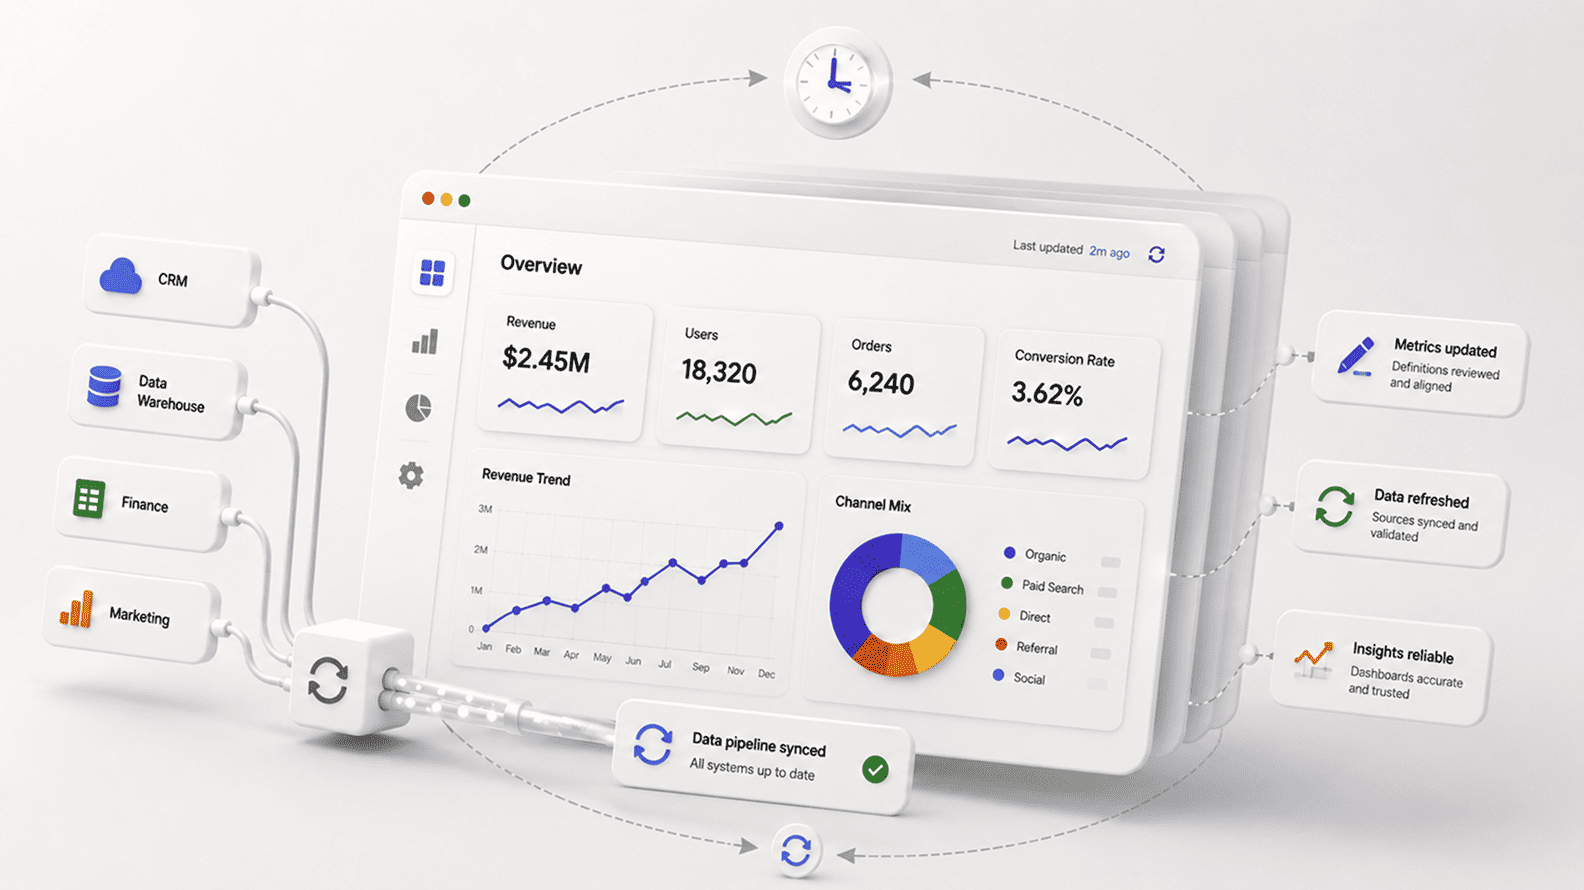
Microsoft makes a similar point in its description of a BI and analytics Center of Excellence, where the central function establishes the platform, helps create a single source of truth, and defines consistent company-wide metrics, while larger organizations may also use department-level satellite groups that understand local taxonomies and business definitions.
The practical idea inside Microsoft’s COE model is simple: central control without business closeness becomes slow, and local freedom without shared standards becomes chaos.
Remote specialists are useful because they can add capacity, technical depth, and delivery speed without forcing the company to hire a full internal team immediately. But they should not become a shadow analytics department that invents numbers in isolation. The company still needs internal ownership.
A remote specialist can calculate gross margin. The business must decide what gross margin means. A remote specialist can build a customer churn dashboard. Customer success and finance must agree whether churn is counted by logo, revenue, contract value, product line, downgrade, or renewal status.
| Operating Model | Where Remote Specialists Fit Best | Main Risk | How to Make It Work |
| Centralized analytics | Extra capacity for reporting queues, BI builds, data cleaning, and documentation. | A remote team becomes a ticket factory with a weak business context. | Assign business partners and require every request to include decision context. |
| Embedded analytics | Specialists work directly with a department such as finance, sales, marketing, or operations. | Each department creates its own definitions and reporting logic. | Use central metric standards and periodic cross-functional reviews. |
| Hybrid analytics | Remote specialists support domains while following central governance, documentation, and quality standards. | Coordination can become heavy if roles are vague. | Define ownership, lanes, handoffs, and approval rules upfront. |
| Project-based analytics | Useful for audits, migrations, dashboard rebuilds, reporting cleanup, or one-time strategic analysis. | Knowledge leaves when the project ends. | Require documentation, handover recordings, data dictionaries, and admin access transfer. |
The first mistake many companies make is expecting a remote analyst to start producing final dashboards immediately. That feels efficient, but it usually creates rework. A serious analytics specialist needs a short discovery period because the visible report is only the surface. They need to understand systems, definitions, stakeholders, business cadence, data access, and the political weight of certain numbers.
A good onboarding process should cover the company’s revenue model, customer journey, sales stages, marketing funnel, finance close cycle, operational workflows, product hierarchy, data sources, existing dashboards, recurring reports, known data issues, and the real users of analytics. This does not require a month of meetings.
It requires well-prepared artifacts and one or two focused walkthroughs with the right people. The remote specialist should leave onboarding knowing which reports are trusted, which are tolerated, which are broken, and which numbers leadership watches closely.
This is where remote work discipline helps analytics. GitLab’s remote work handbook argues for a handbook-first habit where protocols, updates, solutions, and guidance are documented in a single source of truth before they are scattered across chat or private conversations.
That principle from GitLab’s phases of remote adaptation translates directly into analytics onboarding. If every metric explanation lives in someone’s head, every remote specialist starts from zero. If definitions, data maps, and report inventories exist in writing, the specialist can become useful faster and with fewer mistakes.
Most analytics problems start before the analyst touches the data. A business user sends a message asking for a dashboard, a comparison, a trend, or a data pull. The request sounds clear to the sender because they already know the context. It is not clear to the analyst because the request is missing the decision behind the work.
A weak request says, “Can you share lead conversion by source?” A strong request says, “We are reviewing paid spend on Friday and need to know which sources produced sales-qualified opportunities in the last two quarters. Please exclude test campaigns, use opportunity created date, and show both volume and conversion rate.
Marketing will use this to decide whether to reduce LinkedIn spend and increase search spend.” The second request saves hours because it tells the specialist what the number is for.
Remote analytics teams should use a simple intake format, even if the request comes through Jira, Asana, Monday, ServiceNow, Teams, Slack, email, or a shared form. The tool matters less than the information. The intake format forces business users to explain the question, the decision, the audience, the deadline, the metric, the source, and the output. It also gives the specialist permission to push back when the request is actually unclear.
| Intake Field | Why It Matters |
| Business question | Prevents the analyst from building a report that answers the wrong problem. |
| Decision or action | Clarifies whether the output will influence spend, hiring, forecasting, pricing, performance review, or operations. |
| Audience | A CEO view, finance view, sales manager view, and analyst view need different levels of detail. |
| Metric definition | Stops silent disagreement about revenue, pipeline, conversion, churn, utilization, or margin. |
| Data source | Avoids confusion when similar numbers exist in CRM, ERP, BI, spreadsheets, and finance systems. |
| Time period and filters | Prevents mismatched date logic, timezone issues, excluded segments, and inconsistent cohorts. |
| Output format | Determines whether the result should be a dashboard, spreadsheet, slide, memo, alert, or dataset. |
| Approval owner | Creates accountability for sign-off and prevents endless opinion loops. |
A remote analytics setup breaks down when every request is treated the same way. A one-off data check does not need the same process as a board dashboard. A recurring revenue report does not need the same freedom as exploratory analysis. A governed sales performance dashboard should not be changed casually because one manager wants a different filter before a meeting.
The cleanest model is to split work into three lanes: exploratory analysis, recurring business reporting, and production analytics assets. Exploratory analysis is where speed matters. Recurring reporting is where reliability matters. Production analytics is where governance matters. Remote specialists can work across all three, but each lane should have a different standard for documentation, testing, review, and sign-off.
| Lane | Typical Work | Quality Bar | Best Collaboration Style |
| Exploratory analysis | One-off questions, early hypotheses, rough cuts, quick segment checks, scenario analysis. | Clear caveats, visible assumptions, source notes, and fast feedback. | Async request plus one short clarification call if needed. |
| Recurring reporting | Weekly dashboards, monthly reports, operating reviews, campaign reports, sales trackers. | Consistent logic, refresh checks, version control, documented definitions, and named owner. | Scheduled review rhythm with written change log. |
| Production analytics assets | Board dashboards, finance-approved revenue views, executive dashboards, governed semantic models. | Formal approval, tested logic, access control, data quality checks, lineage, and maintenance plan. | Cross-functional review with finance, operations, business owner, and analytics lead. |
Tableau’s governance guidance frames governance as the way organizations maintain security and data integrity while giving users confidence in analytics. Remote teams need that confidence even more because trust cannot be repaired through hallway conversations. It has to be built into the workflow.
Remote analytics work fails when teams swing too far in either direction. If everything happens in meetings, the specialist spends the day collecting context instead of doing analysis. If everything happens in chat, nuance gets lost and decisions disappear into long threads.
Good remote analytics needs a deliberate mix: written intake, documented assumptions, short live conversations for ambiguity, recorded walkthroughs for complex logic, and written sign-off for production numbers.
GitLab’s communication guidance is useful because it does not pretend that remote work means avoiding live conversation. It encourages asynchronous communication when possible, while also recognizing when synchronous communication is more appropriate, and it asks teams to direct decisions and discussions toward a shared source of truth.
That balance from GitLab’s communication handbook is exactly what remote analytics teams need. The analyst should not need a meeting to learn what a dashboard title means, but they may need a live conversation to understand why finance and sales disagree over pipeline treatment.
The practical rule is simple. Use async for facts, updates, definitions, task status, data notes, and decision records. Use live calls for ambiguity, trade-offs, stakeholder disagreement, executive interpretation, and first-time walkthroughs of complex analysis. After every important live discussion, write down the decision. Otherwise the meeting creates temporary alignment and permanent confusion.
| Situation | Best Format | Why |
| New request with clear scope | Ticket or shared request form | Keeps context visible and avoids repeated questions. |
| Metric definition disagreement | Short live call plus written decision note | People need discussion, but the final definition must live in writing. |
| Dashboard feedback | Annotated screenshots or comments inside the BI tool | Keeps feedback attached to the asset being changed. |
| Weekly analytics status | Async update with blockers, shipped items, next priorities | Reduces meetings and helps leaders see progress. |
| Executive dashboard handover | Live walkthrough plus recorded explanation | Supports interpretation and later onboarding. |
| Data quality incident | Alert, issue log, owner tag, impact summary | Creates urgency and preserves the audit trail. |
The biggest misconception about remote analytics is that the specialist can fully own the number. They can own the calculation quality, the query, the dashboard design, the validation steps, the documentation, and the delivery discipline. They cannot own the business meaning alone.
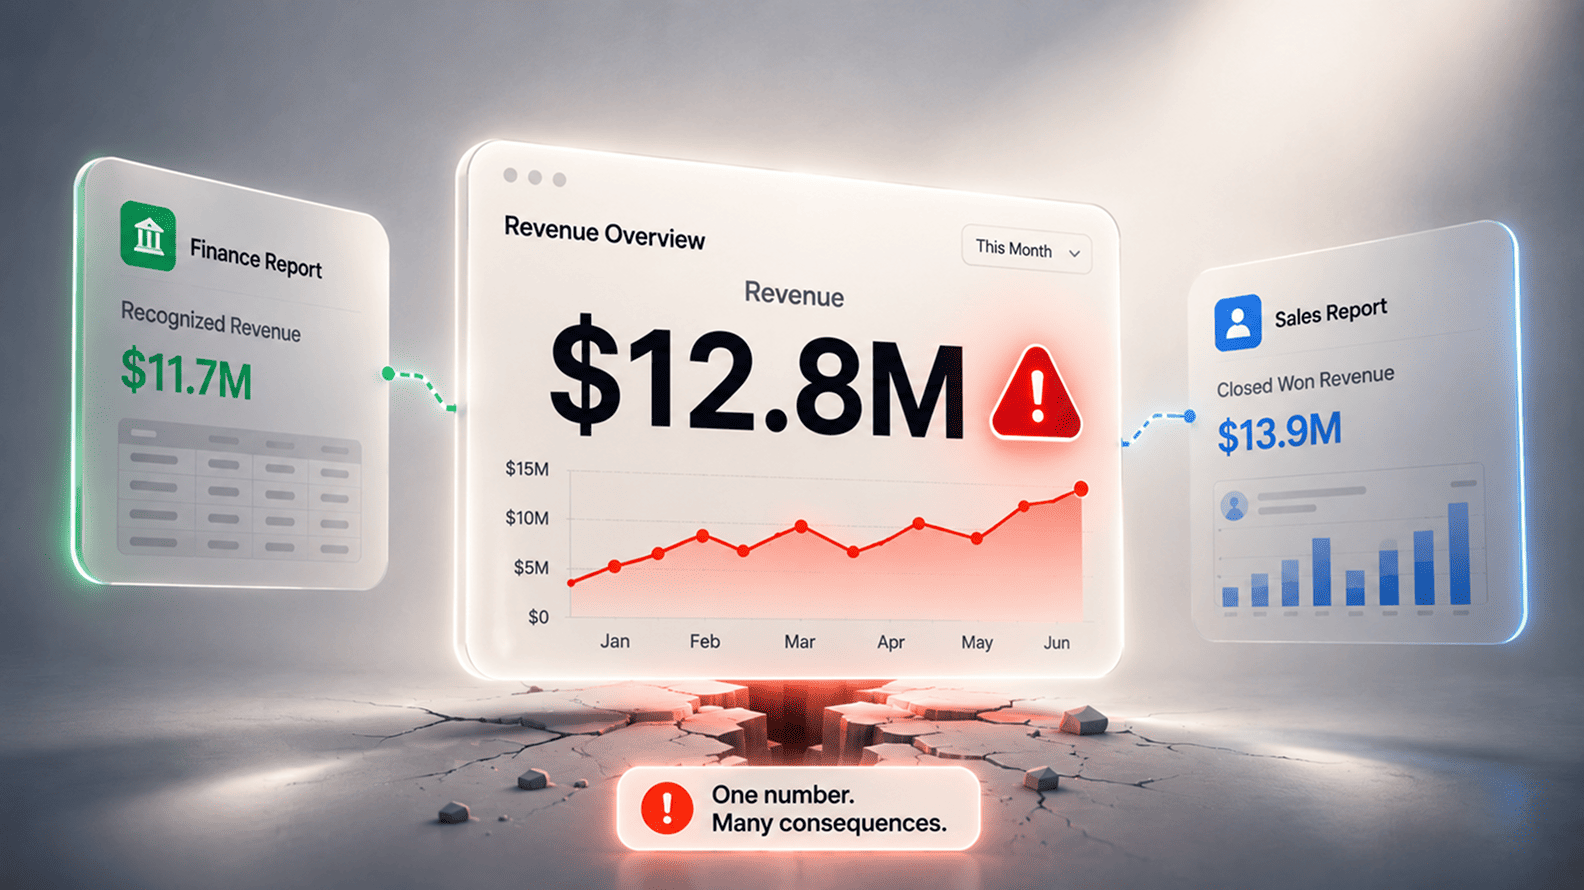
A remote specialist can tell you that two revenue reports do not match because one uses invoice date and the other uses recognition date. Finance must decide which number is used for which conversation. A remote specialist can show that marketing leads are being counted twice because paid and organic attribution rules overlap.
Marketing and sales must decide how source of truth attribution should work. A remote specialist can show that utilization drops when bench time is included. Operations must decide whether utilization is measured as billable hours, available hours, or contracted capacity.
This is why every serious remote analytics arrangement needs named internal owners for critical metrics. Ownership does not mean the business owner writes SQL or builds the dashboard. It means the business owner approves the definition, explains exceptions, resolves disputes, and accepts responsibility when the metric is used in planning, incentives, or leadership reporting.
| Metric Area | Likely Business Owner | Remote Specialist Contribution |
| Revenue | Finance or revenue operations | Calculate, reconcile, document logic, compare sources, build reporting views. |
| Pipeline | Sales leadership or revenue operations | Model stage logic, track movement, analyze conversion, flag CRM hygiene issues. |
| Marketing conversion | Marketing operations or demand generation lead | Connect campaign data, define cohorts, calculate rates, identify attribution gaps. |
| Customer churn | Customer success, finance, or revenue operations | Build logo and revenue churn views, segment causes, monitor retention trends. |
| Utilization | Operations or delivery leadership | Calculate capacity, billability, bench impact, team-level productivity, and variance. |
| Margin | Finance and operations together | Bring cost, revenue, delivery, and allocation data into a consistent reporting model. |
Remote analytics requires access. Access creates risk. That does not mean companies should avoid remote specialists. It means access needs structure from day one. The specialist should have the minimum access needed to do the work, role-based permissions, named accounts, approved tools, secure credential handling, and clear restrictions on local downloads or personal storage.
Internal teams should classify data before granting access. Sales pipeline data, HR data, salary data, customer financial information, health information, payment records, legal documents, and personally identifiable information should not be treated like ordinary campaign performance data.
If the analyst needs sensitive data, the company should define why, who approved it, how it is accessed, where outputs are stored, and how access is removed when the work ends.
This is especially important when remote specialists are outside the company’s payroll structure. The contract, process, and tool design must answer basic questions. Can the specialist export data? Can they connect BI tools to source systems?
Can they view customer-level records? Can they use sample data for development? Are screenshots allowed? Where should working files live? Who reviews access periodically? Who removes access after offboarding?
A weak analytics specialist accepts every request literally. A strong one asks why. That can annoy business teams at first because they want the answer quickly. Over time, it saves everyone from polished dashboards that are technically correct and practically useless.
When a sales leader asks for a win rate, the specialist should ask whether it should be calculated by opportunity count, revenue value, stage entry cohort, closed period, created period, new business only, renewals included, or all opportunities.
When marketing asks for campaign ROI, the specialist should ask whether ROI should use pipeline, bookings, recognized revenue, gross profit, or collected cash. When finance asks for revenue by customer segment, the specialist should ask where the customer segment is mastered and what happens when the CRM and billing system disagree.
Business teams often discover that their own definitions are unclear only when someone tries to calculate them precisely. The remote specialist’s job is to surface that ambiguity early, frame options, recommend a workable definition, and document the final choice.
A practical remote analytics workflow has six stages. It starts with intake, moves into clarification, then data discovery, analysis or build, review, and maintenance. The workflow can be lightweight, but it should exist. Without it, every request becomes a custom negotiation.
The review stage is the one companies underinvest in. They may review layout and formatting, but they do not review meaning. The question should not be only whether the chart looks right. It should be whether the number is right, whether the definition is acceptable, whether the audience will interpret it correctly, and whether the report should be trusted for the decision it supports.
Analytics work becomes sharper when the specialist understands the business calendar. Sales has weekly pipeline calls, monthly targets, quarterly forecasts, territory reviews, and compensation cycles. Finance has close deadlines, budget cycles, variance reviews, audit needs, and board reporting.
Marketing has campaign launches, spend reviews, content calendars, and lead quality debates. Operations has capacity reviews, utilization checks, staffing decisions, service levels, and escalation meetings.
A remote specialist does not need to attend every meeting. That would be wasteful. But they should know which meetings exist, which reports feed those meetings, which numbers are under pressure, and which changes are coming. If the sales team changes opportunity stages, the analyst should know before the dashboard breaks.
If finance changes revenue recognition treatment, the reporting logic should be updated before the monthly pack is sent. If marketing launches a new channel, the campaign taxonomy should be captured before attribution becomes messy.
The best way to do this is to give the specialist a weekly business context note. It can be simple: new campaigns launched, sales stages changed, new products added, large customer movements, finance logic changes, system migrations, known data incidents, upcoming leadership reviews, and decisions made last week. This small habit prevents a large amount of analytical drift.
In office-heavy cultures, documentation often feels optional because people rely on proximity. Someone knows where the spreadsheet came from. Someone remembers why the dashboard excludes enterprise accounts. Someone can ask the finance manager across the room why the April revenue number changed. Remote analytics has less room for that kind of memory. Documentation becomes the operating memory of the team.
Documentation does not need to become a 200-page manual. It should be useful, searchable, and close to the work. A dashboard should explain what each metric means, what data source it uses, when it refreshes, who owns it, what filters are applied, and what should not be inferred from it.
A dataset should explain the source, grain, joins, exclusions, and known caveats. A metric should have a business owner and a calculation owner. A change should have a short log explaining what changed and why.
This is consistent with modern analytics engineering practice. dbt’s article on collaborative analytics engineering emphasizes that analytics code often contains complex business logic, which makes documentation of lineage, transformation logic, and business rules essential for teams that need to understand and maintain each other’s work. For remote specialists, this is not a nice add-on. It is how continuity is protected.
Remote analytics teams need clear validation habits. A dashboard that reaches leadership with the wrong number damages trust far beyond the original mistake. People start asking whether other reports are wrong. They create backup spreadsheets. They stop using the dashboard. Then the company has paid for analytics infrastructure and recreated manual reporting around it.
The quality process should be practical. The specialist should compare output against known source totals, previous reports, finance-approved numbers, row counts, expected ranges, sample records, and edge cases. They should check whether filters behave correctly, whether joins multiply records, whether null values are being hidden, whether time zones affect daily reporting, whether refresh timestamps are visible, and whether dashboard labels match business definitions.
For recurring and production-grade assets, companies should add peer review. Another analyst, internal data owner, or technical lead should review key calculations and assumptions. The review does not need to be slow, but it must be real. The business owner should validate meaning. The specialist should validate logic. The data or BI lead should validate durability.
Some companies hire remote analysts and then use them only for repetitive pulls. Every morning someone asks for yesterday’s leads. Every week someone asks for the same sales breakdown. Every month someone asks for the same finance bridge. The analyst becomes a human API, moving numbers from systems into spreadsheets. That may solve the short-term backlog, but it wastes the real value of analytics talent.
The better approach is to use the first few cycles to understand the recurring need, then automate it or convert it into a maintained reporting asset. If the same report is requested multiple times, it should be reviewed for automation. If the same spreadsheet is manually refreshed every week, it should be connected to a governed dataset or standardized extract. If the same question comes from multiple departments, it may need a shared dashboard or metric definition.
Remote specialists often see reporting waste more clearly than internal teams because they receive the requests in concentrated form. They can identify duplicate dashboards, manual reports that should be retired, spreadsheets with fragile formulas, reports nobody uses, and metrics that mean different things in different teams. Companies should ask them for this diagnosis instead of treating them only as production capacity.
Remote analytics arrangements become messy when every stakeholder gives direct instructions with equal urgency. Marketing wants campaign performance. Sales wants pipeline movement. Finance wants revenue reconciliation. Operations wants utilization. Leadership wants everything by tomorrow. If the remote specialist has no internal partner to prioritize the work, the loudest request wins.
There should be one internal data partner, analytics lead, operations lead, or business sponsor who owns prioritization. This person does not need to manage every technical detail. They need to protect the queue, settle conflicts, identify urgent work, reject unclear requests, and ensure the specialist’s time goes toward business value. Without this role, the remote specialist is forced to become both analyst and traffic controller.
Prioritization should be transparent. A simple weekly queue review is enough for many teams: what shipped, what is in progress, what is blocked, what is next, what needs business input, and what should be stopped. This gives internal teams visibility without requiring constant status meetings.
Imagine a mid-sized company where marketing, sales, and finance all use different reports. Marketing tracks leads and campaign influence in HubSpot. Sales tracks opportunities in Salesforce. Finance tracks invoicing and recognized revenue in an ERP. Leadership wants one weekly revenue performance dashboard, but the three departments keep showing different numbers.
A remote analytics specialist should first understand what the dashboard is meant to decide: growth, cash, forecast, campaign efficiency, sales execution, or customer quality. The real work is then to connect the parts of the business that hold different pieces of the truth.
Marketing may own campaign source, sales may own opportunity stage, and finance may own recognized revenue. The specialist brings these views together, checks where the numbers agree or break, documents the assumptions, and builds a dashboard internal teams can trust. Done well, remote analytics is not just chart-building. It turns scattered data into a shared operating language.
Most remote analytics failures are predictable. They are not caused by distance alone. They are caused by unclear ownership, loose access, undocumented definitions, weak review, poor prioritization, and a habit of sending requests without context. The fix is usually less dramatic than leaders expect. It requires structure, not ceremony.
| Failure Point | What It Looks Like | Fix |
| No context | The analyst receives dashboard requests without knowing the decision behind them. | Use a mandatory intake format with business question, audience, decision, and owner. |
| No metric owner | Different teams argue over numbers after the dashboard is built. | Assign business owners for each critical metric before production reporting. |
| Too many direct requesters | The remote specialist is pulled in five directions at once. | Create one prioritization owner and a visible queue. |
| Weak data access process | Access is delayed, overbroad, or granted through shared credentials. | Use role-based access, named accounts, approval workflow, and offboarding checklist. |
| No review process | Reports are launched without business validation or technical checks. | Add peer review for logic and business sign-off for meaning. |
| Poor documentation | Only one person understands the report logic. | Document data sources, definitions, filters, refresh cadence, owners, and caveats. |
| No maintenance rhythm | Dashboards decay after launch. | Schedule quarterly dashboard review, usage checks, access review, and retirement decisions. |
The wrong way to measure remote analytics is to count only the number of dashboards shipped. Dashboard volume can hide bad work. A team can produce twenty dashboards and still leave the business confused. The better measures look at usefulness, trust, speed, adoption, and reduction of manual effort.
A good scorecard combines delivery metrics and business metrics. Delivery metrics show whether the work is moving. Business metrics show whether the work matters. A remote analytics specialist who reduces monthly reporting effort by 40 hours, reconciles revenue logic across teams, and replaces five manual spreadsheets with one trusted reporting flow may create more value than someone who builds a dozen attractive dashboards no one uses.
| Measure | What It Shows |
| Turnaround time by request type | Whether simple requests are moving quickly and complex requests are being planned properly. |
| Report adoption and active users | Whether dashboards are actually being used by the intended audience. |
| Manual reporting hours reduced | Whether analytics work is removing repetitive operational burden. |
| Number of reconciled priority metrics | Whether the company is reducing definition drift across departments. |
| Data quality incidents caught before business impact | Whether validation and monitoring are working. |
| Stakeholder satisfaction | Whether business users trust the output and feel supported. |
| Retired reports | Whether the analytics environment is getting cleaner rather than more crowded. |
A strong remote analytics specialist brings more than technical skill. SQL, Excel, Power BI, Tableau, Looker, Python, dbt, and data modelling matter, but the more valuable trait is judgment. The specialist should understand when to move fast, when to slow down, when to ask for definitions, when to challenge the request, when to escalate a data quality issue, and when a dashboard should not be built yet.
They should be comfortable with ambiguity, but not casual about it. They should be able to translate business questions into analytical logic, explain trade-offs in plain language, and document assumptions clearly. They should not hide behind technical language when a number does not make sense. They should be able to say, “This report can be built, but the current data does not support the decision you want to make.”
They should also understand that internal teams are busy. Business users do not want lectures on data modelling. They want clarity. The specialist’s job is to make the analytical process easier for them without lowering the quality bar. That means clean request templates, clear visuals, short explanations, visible caveats, and practical recommendations.
Internal teams also have to change. They cannot expect remote specialists to succeed with half-access, unclear priorities, hidden definitions, and last-minute requests. If the company wants serious analytics output, it must behave like analytics is part of the business process.
That means giving remote specialists enough access to understand the work, enough context to interpret the data, enough authority to ask questions, and enough visibility to see how reports are used. It also means protecting them from randomization. If every request is urgent, the company has no analytics strategy. It has reporting noise.
The best internal teams learn to treat analytics as a partnership. They bring business context. The specialist brings analytical discipline. Together, they build reports, definitions, checks, and decision tools that survive beyond one meeting.
Remote data and analytics specialists work best when they are not treated as extra hands for reporting, but as part of the company’s decision system. The location of the analyst matters far less than the quality of access, context, ownership, and trust around the work.
A remote specialist can clean data, build dashboards, reconcile numbers, automate reports, and document logic, but the company still has to explain what the numbers are meant to decide and who has the authority to define them.
This is where the model either becomes powerful or starts feeling like outsourcing. If requests arrive without context, the analyst can only produce outputs. If the business shares priorities, definitions, source-system knowledge, decision deadlines, and ownership, the analyst can produce work that people actually use.
The difference is visible in the meetings that follow. Weak setups create more clarification, more reconciliation, and more private spreadsheets. Strong setups give teams a common view of growth, cash, pipeline, churn, campaign performance, customer quality, and operational pressure.
The best remote analytics relationships are built on a simple division of responsibility. Internal leaders own the business meaning. They decide which metrics matter, what each number is allowed to represent, and where the final call sits when departments disagree.
The remote specialist owns the analytical execution: pulling the data together, testing the logic, documenting assumptions, building the reporting layer, improving recurring dashboards, and making the work easier to maintain over time. When both sides do their part, remote analytics becomes more than a capacity solution. It becomes a cleaner way for the business to think.
A company does not need analysts sitting in the same office to make better decisions. It needs analysts who are close to the business context and internal teams who are disciplined enough to share that context properly. When those lines are clear, remote analytics stops feeling like work sent outside the company. It starts feeling like an extension of the company’s operating brain.
Yes, but only if the company gives them structured context instead of isolated tasks. A remote analyst does not need to sit in the office to understand a sales funnel, revenue model, customer journey, or reporting issue. They do need access to the people, systems, definitions, reports, and decision rhythm that shape those numbers. Without that, even an in-house analyst would struggle.
The best way to make this work is to start with a business and data onboarding process. Share current dashboards, recurring reports, sales process notes, metric definitions, known reporting issues, and examples of decisions that depend on analytics. A good remote analyst will then ask sharper questions, spot gaps faster, and become useful much sooner.
Give them the company’s reporting map, not just tool access. They should see the CRM, ERP, billing system, marketing platform, BI tool, warehouse, recurring spreadsheets, board report structure, and key dashboards. They should also know which reports are trusted, which are disputed, and which ones are still used only because nobody has replaced them.
The first week should also include conversations with the main business owners. Finance should explain revenue and margin logic. Sales should explain pipeline and stage rules. Marketing should explain campaign tracking and lead qualification. Operations should explain capacity, delivery, and utilization logic. This gives the specialist the practical context needed to avoid wrong assumptions.
They should join the meetings where analytics context is created or interpreted, especially early in the relationship. That might include a weekly sales review, a finance reporting walkthrough, a marketing performance review, or a dashboard planning session. They do not need to attend every operational meeting because that quickly becomes wasteful.
A better rhythm is selective meeting attendance combined with strong async documentation. Invite the specialist when definitions are changing, reports are being reviewed, or numbers are being challenged. After the meeting, document the decision in the dashboard notes, metric glossary, ticket, or shared analytics workspace so the context does not disappear.
A data analyst usually focuses on business questions, trends, segmentation, interpretation, and decision support. They may use SQL, Excel, Python, or BI tools, but the center of the role is analysis. A BI developer is more focused on dashboards, data models, report design, refresh logic, semantic models, and the technical structure that makes reporting repeatable.
In smaller companies, one person may do both. In larger setups, the analyst works closely with business teams while the BI developer or analytics engineer handles data modelling and production reporting. The important thing is to define which role you need before hiring, because a strong dashboard builder may not be the right person for open-ended commercial analysis, and a strong analyst may not be the right person to maintain a complex BI environment.
There should be one internal owner who manages priorities and business context. This could be a head of analytics, operations lead, revenue operations manager, finance leader, marketing operations lead, or project owner. The remote specialist can work with many departments, but the queue needs one person who can decide what matters most.
Without that owner, the remote specialist gets pulled into competing requests from every team. The result is slow delivery, unclear expectations, and frustration on both sides. A weekly queue review, clear intake process, and named approval owner are usually enough to keep the work organized.
Start with role-based access, named accounts, and least-privilege permissions. Do not share generic logins. Do not grant broad access because it is quicker. Decide which systems and fields the specialist actually needs, then approve access through a documented process. Sensitive data such as salary, customer financial records, health information, contracts, and personal identifiers should be handled with tighter controls.
You should also define where work files can live, whether exports are allowed, how credentials are managed, which tools can be used, and how access will be removed after the engagement ends. Security should not be treated as a blocker to remote analytics. It should be treated as part of the operating model.
Enough that another competent analyst could understand the logic without chasing people in chat. Every important dashboard should explain the data source, refresh cadence, metric definitions, filters, exclusions, owner, and known caveats. Every production metric should have a business owner and a calculation owner. Every major change should have a short change log.
Documentation should be close to the work. Put definitions inside the BI tool, data catalogue, shared wiki, dbt docs, ticketing system, or dashboard notes. The goal is not paperwork. The goal is continuity. When the remote specialist changes, the dashboard should not become a mystery.
Remote specialists are well suited for dashboard builds, recurring report automation, data cleanup, metric reconciliation, SQL analysis, campaign reporting, sales funnel analysis, finance reporting support, data quality checks, report audits, and documentation. They can also help internal teams migrate from manual Excel reporting into more structured BI workflows.
They are less effective when the request is politically sensitive but nobody has defined the owner, when data access is blocked, or when the company expects them to resolve business disagreements alone. Remote analysts can reveal the disagreement. They should not be forced to settle strategic or financial policy decisions without the relevant internal leaders.
Build the system so the work survives the person. Use shared repositories, shared BI workspaces, documented definitions, version-controlled logic, named owners, recorded walkthroughs, and handover notes. Avoid keeping critical logic only in local files, personal accounts, private chats, or undocumented SQL snippets.
A good remote specialist should help reduce dependency over time by documenting work, standardizing reports, automating recurring tasks, and training internal users. If the relationship is healthy, the company becomes less fragile, not more fragile.
Look at business usefulness, not only delivery volume. Good signs include fewer manual reports, faster answers to recurring questions, higher dashboard usage, fewer disputes over numbers, cleaner metric definitions, better data quality visibility, and more confident decision-making in leadership meetings.
You should also ask business users whether the work is helping them make decisions. Analytics is not successful because a dashboard exists. It is successful when people trust the numbers, understand the logic, and use the output to change spend, staffing, pricing, forecasting, operations, or customer strategy.
Aug 04, 2026 / 27 min read
Aug 04, 2026 / 22 min read
Jul 31, 2026 / 24 min read