Why Marketing, Sales, And Finance Reports Do Not Match
Aug 04, 2026 / 27 min read
July 24, 2026 / 35 min read / by Team VE

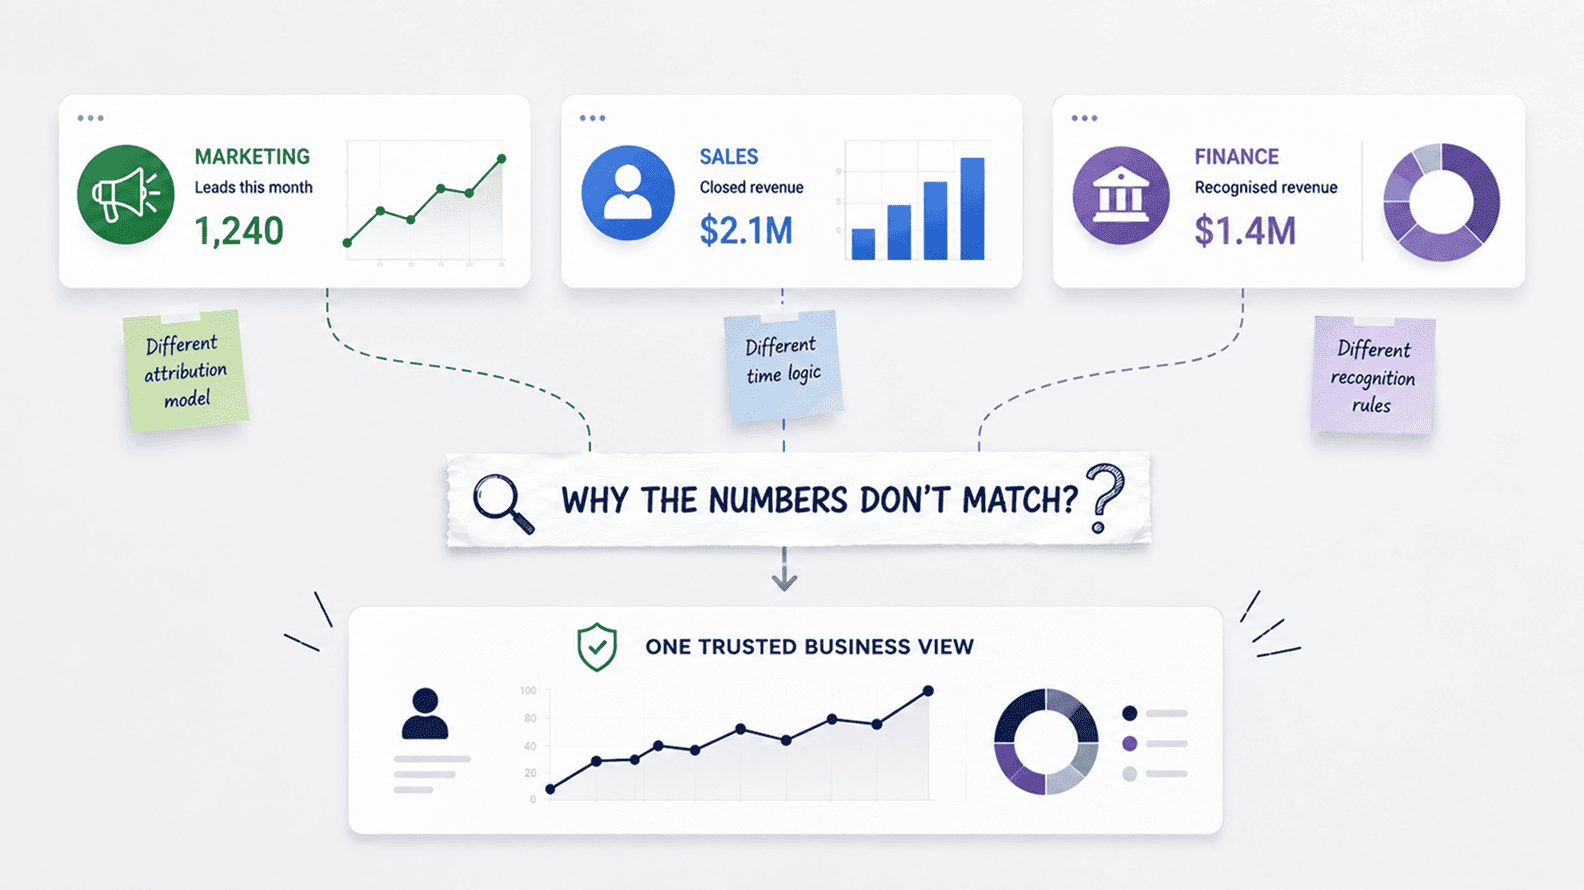
Metric definition drift happens when a company keeps using the same business word while the calculation underneath changes across teams, tools, reports, or meetings. A lead can mean a campaign response to marketing, a qualified record to sales, and a future revenue opportunity to finance.
Revenue can mean bookings in a sales review, invoices in billing, collections in cash planning, and recognized revenue in finance. Everyone may be using a useful version of the number, yet the shared label creates confusion because the business has not made the differences visible enough.
The cost shows up in slow reviews, disputed forecasts, weak campaign judgements, awkward incentive conversations, and leaders asking which dashboard can be trusted before they discuss what the business should do. Strong companies reduce that friction by giving important metrics a clear purpose, owner, calculation, source, date logic, exclusions, refresh rhythm, variant names, and change history.
The aim is controlled meaning: different metric versions can exist when they support different decisions, but each version needs a name, context, and authority so a familiar word does not quietly carry five different truths.
Metric definition drift is the gradual separation between a metric’s name, its calculation, and the way different departments believe the metric should be used. It usually begins when teams adapt a shared metric for local decisions without updating the shared definition, the BI model, the glossary, the dashboard label, or the change history. In plain business language, metric drift is what happens when the company’s vocabulary stays the same while the business underneath becomes more complex.
Twitter gave investors a useful public example of how much weight a metric definition can carry. In its 2018 annual filing, the company defined monetizable daily active usage or users, known as mDAU, as Twitter users who logged in and accessed Twitter through products able to show ads. The filing also said the metric was based on internal company data.
Later filings warned that mDAU was not based on a standardized industry methodology and was not necessarily comparable with similarly titled metrics used by other companies. For anyone running business analytics, the lesson is clear: a metric name can sound familiar while the definition underneath is highly specific to the company, the model, and the decision it supports. Twitter’s SEC filing on mDAU shows why the definition matters before the chart ever appears.
The same thing happens inside ordinary companies without becoming investor news. A leadership team asks why the pipeline has slowed. Marketing opens a campaign dashboard and shows that lead volume is up. Sales opens the CRM and shows that qualified opportunities are flat.
Finance looks at the revenue view and says neither number explains booked or recognized revenue. Each team may be describing a real part of the business, yet the meeting slows because the shared words are doing too much work.
Metric drift often begins quietly because the first change is usually reasonable. Marketing excludes test leads from campaign performance. Sales operations change stage logic after the CRM workflow changes. Finance shifts from bookings to recognized revenue for a board pack.
Product moves from login-based activity to meaningful usage because the older definition no longer reflects customer value. Each adjustment may improve a local report, but the company loses trust when the change does not travel back into the shared definition, dashboard label, glossary, or metric owner’s record.
The deeper problem is scale. Early teams often rely on shared memory because the same people know what lead, revenue, active customer, and churn mean in practice. As the business adds teams, regions, products, pricing models, sales motions, finance rules, customer segments, and reporting layers, memory stops being enough.
A familiar metric name starts carrying old assumptions into a newer business. That is the point where analytics teams need a tighter operating model for meaning, because the argument is no longer about arithmetic. It is about which version of the business the metric is allowed to represent.
Metric drift often begins with reasonable people doing reasonable work. Marketing needs to understand demand, so it studies the first moment a prospect shows interest. Sales needs to understand readiness, so it cares about fit, urgency, authority, and the chance of a real conversation.
Finance needs evidence that can survive planning, reporting, and audit. Product wants to know whether people are actually using the thing in a way that signals value. Customer success wants to know whether usage, support history, renewal timing, and commercial relationship point toward risk. The same word travels across these teams because the business wants one language, but the work underneath that language is different.
A lead is a good example because it carries so much hidden tension. For marketing, a lead may begin when someone attends a webinar, downloads a guide, submits a demo form, or responds to a campaign. For sales, that same person may not become meaningful until the record is deduplicated, enriched, qualified, accepted, and attached to a real opportunity.
For finance, the lead has no commercial weight until it becomes revenue. None of these teams is automatically misusing the word. They are standing at different points in the same journey, and the drift begins when the company keeps calling every stage by the same broad name.
The same pattern appears in pipeline, revenue, churn, active customer, utilization, and conversion rate. Pipeline may mean campaign-influenced opportunity value in a marketing review, forecastable open opportunity value in a sales review, and risk-adjusted future revenue in a finance review.
Churn may mean lost logo for customer success, lost MRR for finance, downgrade for revenue operations, or falling engagement for product. Conversion rate may mean visitor to demo request, demo to qualified opportunity, opportunity to closed-won, or invoice to collected cash. The phrase survives, but the decision behind it changes.
| Metric Word | Why Teams Pull It In Different Directions | What A Cleaner Setup Should Do |
| Lead | Marketing, sales, and finance see different stages of demand becoming revenue. | Name the funnel stages clearly, from raw inquiry to qualified opportunity and customer. |
| Pipeline | Marketing wants influence, sales wants forecastability, finance wants commercial discipline. | Separate marketing-influenced, sales-accepted, forecast, and finance-reviewed pipeline. |
| Revenue | Commercial momentum, billing, collections, recognition, and recurring value all matter. | Label booked, billed, collected, recognized, net, recurring, and expansion revenue separately. |
| Churn | Product, customer success, and finance each see loss through a different lens. | Distinguish logo churn, revenue churn, contraction, downgrade, non-renewal, and usage decline. |
| Active Customer | Engagement, relationship ownership, billing status, and renewal risk are not the same state. | Define active by the decision, such as product usage, paid status, contract status, or renewal ownership. |
| Conversion | Every team measures movement from one stage to another. | Always name the start point, end point, time window, and exclusions. |
The important shift is to stop treating local variation as a failure. A business may need several versions of a metric because different decisions genuinely require different lenses. The damage comes when those versions stay unnamed inside dashboards, spreadsheets, CRM reports, board packs, and analyst queries.
Once a variant is used repeatedly, it needs a clear label, owner, source, calculation, date logic, and purpose. That small act of naming saves a large amount of future argument because the business can finally see whether teams disagree about performance or simply about the meaning of the metric in front of them.
Metric drift becomes easier to understand when the business stops looking only at the name of the metric and starts looking at the question behind it. Conversion rate is a good example. In a marketing review, it may mean the share of visitors who become leads. In a sales review, it may mean the share of demos that become qualified opportunities.
In a finance review, it may mean the share of signed customers that become paid and collected revenue. The phrase sounds stable because everyone recognizes it, but the business question changes each time the metric moves across the funnel.
This is why familiar KPI names can become dangerous in growing companies. They make teams feel aligned before the company has actually agreed on the unit, population, event, period, exclusions, and decision context. Pipeline may mean marketing-influenced value in one room, forecastable sales value in another, and risk-adjusted future revenue somewhere else.
Active customer may mean product usage, commercial relationship, billing status, renewal ownership, or account engagement. A metric name that once worked well in a smaller company can become too broad once the business has more functions, products, regions, and operating rhythms.
A useful definition starts with the decision rather than the chart. What question is the metric supposed to answer? Which population is being measured? What event qualifies? Which date places it into a reporting period? Which records are excluded? Which source has authority?
Who owns the meaning? Which dashboard or model carries the approved logic? These details are what keep a metric from becoming a polished argument. The analytics tool can display the number beautifully, but the meaning has to be settled before the visual earns trust.
| Metric Name | Hidden Business Questions It May Carry | Cleaner Metric Language |
| Conversion Rate | Which stage converted, from what, into what, and over which period? | Visitor-to-lead conversion, demo-to-SQL conversion, opportunity-to-win conversion, invoice-to-collection conversion. |
| Pipeline | Is the business measuring marketing influence, sales forecast, open opportunity value, or finance-reviewed future revenue? | Marketing-influenced pipeline, sales-accepted pipeline, forecast pipeline, finance-reviewed pipeline. |
| Active Customer | Is the customer active because they use the product, pay invoices, have an owner, or sit inside a renewal cycle? | Product-active customer, billing-active customer, account-managed customer, renewal-active customer. |
| Churn | Is the business measuring lost accounts, lost revenue, downgrades, contraction, non-renewals, or usage decline? | Logo churn, gross revenue churn, net revenue churn, contraction, downgrade, non-renewal. |
| Retention | Is the company tracking customers retained, revenue retained, product usage retained, or cohort behaviour? | Logo retention, net revenue retention, usage retention, cohort retention. |
This distinction matters because many metric disputes are question disputes in disguise. A marketing team may be right about visitor-to-lead conversion while sales is right about demo-to-opportunity conversion. Finance may be right about recognized revenue while sales is right about bookings.
Product may be right about usage activity while customer success is right about renewal risk. The company does not need to flatten these views into one vague number. It needs to name them clearly enough that each metric carries the right question into the right meeting.
Use this tighter version. It keeps the point, removes the lecture tone, and moves faster.
A leadership dashboard can make a company feel aligned for a few weeks. Everyone sees the same revenue card, pipeline chart, churn trend, campaign view, or customer-health score. Then the business changes around it.
Sales updates stages, finance changes product reporting, marketing adjusts attribution windows, customer success separates renewal risk from expansion risk, and product replaces a login-based usage metric with a more meaningful activity signal. The dashboard still looks official, but the definition may now belong to an older version of the business.
This is where metric drift often hides. A report built for one review gets copied for another team, filtered for a region, adjusted for a manager, and reused later as if it were still the approved view. The BI tool gives the number polish, but polish is not the same as authority.
A pipeline report built for sales coaching may be weak for revenue forecasting. A campaign dashboard built for channel optimization may be too loose for board-level growth reporting. A usage chart built around logins may not help renewal planning if the company now knows that only certain feature actions predict retention.
The fix is mostly discipline around the dashboards that matter. Exploratory reports can stay flexible. Leadership reports, incentive metrics, forecast views, and finance-linked dashboards need named owners, visible definitions, clear version history, and a simple way to show when the logic has changed.
Without that, dashboards become another place where old assumptions and local calculations quietly accumulate. A dashboard deserves trust when the metric behind it is current, owned, and understood. Otherwise, it is a clean-looking surface on top of drifting logic.
Metric drift often appears after the hard data work is already done. The warehouse may be clean, the pipelines may be stable, and the source tables may be usable, yet the final number changes because someone adjusted the logic closer to the report. An analyst changes a join to answer one stakeholder’s question.
A dashboard adds a calculated field. A CRM report applies a hidden filter. A finance workbook removes a customer group for one review. A product view changes the activity rule because the older version no longer reflects real usage.
These changes are not automatically wrong. Many are sensible responses to real business pressure. The problem begins when a temporary adjustment becomes part of recurring reporting without being named, reviewed, or moved into governed logic. A one-time filter used for a regional review can later be copied into a leadership dashboard.
A calculation built for a campaign debrief can quietly become the number used in next quarter’s planning. A spreadsheet adjustment made for a board pack can become the version people trust more than the BI model.
This is why the last mile of analytics needs more care than companies usually give it. Reports, workbooks, CRM views, and dashboard-level calculations are often where business meaning is finalized, even when everyone assumes the official logic lives somewhere upstream. Once those last-mile decisions influence forecasts, incentives, budget calls, or leadership reviews, they need the same discipline as any other important metric logic.
| Last-Mile Change | How Drift Enters |
| Dashboard-level calculated field | The same metric starts using different formulas across reports. |
| Hidden report filter | Users compare numbers without seeing what was excluded. |
| Spreadsheet adjustment | Local business judgement becomes unofficial reporting logic. |
| Modified CRM view | Sales or pipeline numbers shift outside the BI model. |
| One-off board-pack cut | A temporary leadership view becomes a recurring definition. |
The safest approach is to notice when a last-mile workaround starts repeating. If the same filter, formula, exclusion, or adjustment is used again and again, it should no longer live quietly inside one report or workbook. It needs a name, an owner, and a proper place in the shared model, so the business can keep the useful logic without allowing the definition to drift in private.
Metric definitions rarely stay neutral once the number starts affecting budgets, targets, bonuses, headcount, campaign judgement, or leadership reputation. A team may argue about pipeline, but the real tension may be about whether marketing gets credit, whether sales missed quality, whether finance trusts the forecast, or whether leadership should invest more in one channel over another. The argument sounds technical because people are discussing filters and formulas. Underneath, the definition is deciding who looks right.
That is why marketing-sourced and marketing-influenced pipelines can become such sensitive territory. Marketing may want influence included because brand, content, events, remarketing, and nurture all contribute to demand before a prospect is ready to speak to sales.
Sales may prefer sourced pipelines because it creates clearer accountability for opportunities that came directly from a campaign. Finance may avoid both when the conversation moves to revenue planning because attribution does not carry the same weight as signed contracts, billing, or recognition. Each view can be useful, but only when the label makes the purpose clear.
The same tension appears in churn, utilization, customer health, productivity, and margin. Customer success may want to show that churn risk was visible months before renewal. The product may argue that usage had already dropped. Finance may focus on lost revenue rather than lost logos.
Operations may report utilization one way for staffing and another way for billing. None of this is unusual. It becomes messy when one department’s working definition becomes the company’s official story by accident.
Mature teams handle this by making the politics visible without making the conversation personal. They separate the metric from the meeting agenda. They name the variants. They decide which version belongs in which review. They give sensitive metrics to an owner with enough authority to close the question. That way, teams can still debate performance, but they are not quietly fighting over the rules while pretending to discuss the result.
Metric ownership goes wrong when companies make it either too technical or too vague. The data team may know how the number is built, but it may not be the right team to decide what a qualified lead, active customer, renewal risk, or finance-ready revenue should mean. The business team may understand the decision, but it may not know how a loose definition will behave once it moves through CRM fields, warehouse tables, dashboard filters, and recurring reports.
The cleanest model is shared ownership. The business owns the meaning. Analytics owns the implementation. Data engineering owns the reliability of the flow. Finance owns the stricter numbers that affect reporting, forecasting, margin, cash, and board-level views. Leadership steps in when a definition changes incentives, budgets, or cross-functional accountability.
| Owner | What They Should Protect |
| Business Metric Owner | Meaning, use case, exclusions, and what the metric is allowed to decide. |
| Analytics Team | Formula, dashboard logic, semantic model, testing, and documentation. |
| Data Engineering | Source reliability, pipelines, lineage, and transformation quality. |
| Finance | Revenue, margin, billing, recognition, cash, and forecast discipline. |
| Leadership | Final calls when definitions affect incentives, targets, or strategy. |
This matters because most metric disputes do not need another dashboard. They need someone with authority to say, “For this meeting, this is the version we use.” Without that, every review becomes a fresh negotiation. Sales defends one pipeline number, marketing brings another, finance applies a third lens, and analytics gets pulled into referee work instead of helping the business understand what changed.
Good ownership keeps the debate earlier and smaller. The company can still have different versions of a metric, but those versions are named, approved, and used in the right places. A sales coaching view can differ from a finance forecast view. A product-active customer can differ from a billing-active customer. The difference is no longer hidden inside a report. It is part of the operating language.
A company does not need one universal version of every metric. In fact, forcing one version often makes the number less useful. Revenue can mean bookings in a sales review, recognized revenue in a finance review, collected cash in a cash-flow discussion, and recurring revenue in a SaaS growth review.
Churn can mean lost customers, lost revenue, downgrade, contraction, or non-renewal. Each version can be legitimate because each one supports a different decision.
The trouble begins when these versions all travel under the same loose label. A slide says revenue, but one leader hears bookings, another hears recognized revenue, and another thinks in terms of cash collected. A dashboard says churn, but customer success is thinking about logos while finance is thinking about lost revenue. The meeting then starts with confusion that could have been avoided by naming the metric properly.
This is where mature analytics becomes almost editorial. The company has to give numbers better titles. “Revenue” may be too broad for an executive review. “Recognized Revenue” or “Net Revenue” may be clearer. “Pipeline” may be too vague for a forecast call. “Sales Forecast Pipeline” says more. “Active Customer” may hide too much. “Billing-Active Customer” or “Product-Active Customer” immediately tells people what kind of activity is being measured.
| Loose Metric Label | Better Metric Language |
| Revenue | Booked Revenue, Recognized Revenue, Net Revenue, Collected Revenue |
| Pipeline | Marketing-Influenced Pipeline, Sales-Accepted Pipeline, Forecast Pipeline |
| Churn | Logo Churn, Revenue Churn, Downgrade, Non-Renewal |
| Active Customer | Product-Active Customer, Billing-Active Customer, Renewal-Active Customer |
| Conversion Rate | Visitor-To-Lead, Demo-To-Opportunity, Opportunity-To-Win |
The discipline is about removing false agreements. When the label is precise, the conversation moves faster because people know which version of the business they are discussing. When the label is vague, the company may spend half the meeting discovering that people were never talking about the same number in the first place.
Metric definitions often live in the wrong places. They sit inside an old slide, a Slack message, a spreadsheet note, a dashboard title, an analyst’s memory, or a comment buried inside a report. That may work when the company is small and the same people are in every meeting. It breaks once teams grow, tools multiply, and new people start using numbers without knowing the history behind them.
A definition needs a place where people can find it, understand it, and trust that it is still current. The business user should be able to see what the metric means in plain English. The analyst should be able to see how it is calculated. The dashboard user should know whether the report is official or just exploratory. The owner should know when the definition was last changed and why.
This does not need to become heavy. For the most important metrics, the company mainly needs clarity on a few things: what the metric means, where it is calculated, which dashboard uses the approved version, who owns it, and whether there are accepted variants. That is enough to stop a lot of confusion before it reaches a leadership meeting.
| What The Business Needs | What It Prevents |
| A plain-English metric definition | People using the same word differently. |
| A trusted calculation layer | Teams rebuild the same metric in different ways. |
| A certified dashboard or report | Old copies becoming the unofficial truth. |
| A named owner | Definition debates repeating in every meeting. |
| A visible change history | People comparing old and new numbers without context. |
The value is not in documentation for its own sake. The value is that a metric has somewhere to live beyond memory and habit. When the definition is easy to find and clearly owned, teams spend less time asking what the number means and more time asking what the number is telling them.
Sometimes the definition has not changed, but the metric still starts behaving differently. The formula is the same, the dashboard is the same, and the label is the same, yet the number no longer means what people think it means because the input data has shifted.
This happens quietly. Customer records get duplicated. Revenue events arrive late. Campaign IDs become inconsistent. Product usage events are renamed. Opportunity stages are overwritten. Geography or segment fields are reclassified. The metric may still be calculated correctly according to the old formula, but the data feeding it is no longer stable enough to support the same interpretation.
A churn metric is a simple example. The company may define churn clearly, but if renewal dates are missing, downgrade reasons are vague, account ownership has changed, or cancelled customers are still marked active in another system, the churn number starts losing meaning. The issue is no longer only definition drift. It is data quality drift entering through the side door.
| Data Issue | How It Changes The Metric |
| Duplicate customers | Customer count, churn, retention, and revenue per customer become inflated or split. |
| Late revenue events | Monthly revenue appears weaker or stronger depending on when data lands. |
| Inconsistent campaign IDs | Attribution becomes unreliable even if the formula is unchanged. |
| Changed product events | Active-user or usage metrics stop comparing like with like. |
| Reclassified regions or segments | Trends shift because the grouping changed, not because performance changed. |
This is why metric trust needs both definition control and data-quality checks. A company may agree perfectly on what a metric means and still misread it if the source data has become messy, late, duplicated, or inconsistent. The definition gives the number meaning. The data underneath decides whether that meaning still holds.
Metric drift rarely announces itself as a data problem. It shows up as meeting behaviour first. Leaders ask which number is right before they ask what the number means. Analysts spend half the review explaining why two dashboards disagree.
Teams bring their own spreadsheets because they no longer trust the official view. A sales number, marketing number, and finance number sit on the same slide, and the room quietly understands that someone will have to reconcile them later.
The signs are familiar. A metric has the same name in two dashboards but different totals for the same period. A board pack needs a reconciliation appendix every quarter. New team members learn definitions by asking people on Slack instead of checking a trusted source.
Reports keep using broad labels like revenue, churn, pipeline, conversion, or active customer without saying which version they mean. None of this feels dramatic on its own, but together it tells you the company’s metric language is starting to fray.
The bigger cost is not the time spent fixing one number. It is the slow loss of confidence around every number after that. Once people believe definitions are loose, they start questioning even the reports that are still sound. Every dashboard becomes a suspect. Every trend needs a caveat. Every review begins with a defensive explanation rather than business judgement.
That is usually the right moment to pause and clean up the metric language before the drift becomes cultural. A company can recover from one disputed dashboard quickly. It is much harder to recover when teams build the habit of trusting their own private version of the business more than the shared one.
Once a metric becomes important, it needs a simple record behind it. Nothing fancy. Just enough clarity so people are not rebuilding the meaning every time the number enters a meeting.
For a serious metric, the company should know what it is called, what question it answers, which records are included, which records are excluded, which date controls the reporting period, which source system is trusted, who owns the meaning, and when the definition last changed. These details sound basic, but most dashboard arguments come from one of them being unclear.
| Metric Detail | What It Settles |
| Official name | Stops loose labels from spreading. |
| Business question | Keeps the metric tied to a real decision. |
| Formula | Shows exactly how the number is calculated. |
| Population | Clarifies which records are eligible. |
| Exclusions | Makes removed records visible instead of hidden. |
| Date logic | Prevents created-date, close-date, invoice-date, and payment-date confusion. |
| Source system | Shows which system has authority. |
| Owner | Gives the definition somewhere to go when it is challenged. |
| Change history | Explains why this month’s number may not compare cleanly with an older one. |
A qualified opportunity is a good example. One team may count it when sales accept a lead. Another may count it only after budget, authority, need, and timing are confirmed. Another may exclude partner duplicates, internal demos, student inquiries, or poor-fit geographies. Without a record, the dashboard label looks simple and the argument begins later. With a record, people can see the rule before they challenge the result.
The point is to make important metrics slightly harder to misuse. A clean definition record will not make every disagreement disappear, but it gives the disagreement a place to land. Instead of debating from memory, the team can see the approved version, decide whether it still fits the business, and update it properly when it does not.
Metric governance often fails because companies make it too grand. They create long documents, form committees, announce a framework, and then the real business keeps moving faster than the governance process. A sales stage changes. A pricing package is added. A new region goes live. A marketing channel is split into two. A customer-success team starts tracking a new risk signal. The definition changes in practice before it changes anywhere official.
The better rhythm is lighter and closer to the work. The company does not need to govern every small report with the same intensity. It needs to protect the numbers that travel into leadership reviews, board decks, forecasts, commissions, budget decisions, product strategy, customer-health conversations, and finance reporting. Those metrics deserve more discipline because people make real decisions from them.
A simple rule helps: when the business changes, the metric should be checked. New pricing should trigger a revenue-definition review. New CRM stages should trigger a pipeline review. New product behaviour should trigger an active-user review. New customer segments should trigger a retention or churn review. This keeps governance from becoming a separate corporate ritual and makes it part of how the business absorbs change.
| Business Change | Metric That May Need Review |
| New pricing or packaging | Revenue, margin, ARR, expansion, contraction |
| CRM stage changes | Pipeline, qualified opportunity, conversion rate, forecast |
| New marketing channel | Lead source, campaign influence, CAC, conversion |
| Product usage changes | Active user, feature adoption, customer health |
| New region or segment | Revenue, churn, retention, utilization, performance trends |
| Incentive plan changes | Sales productivity, quota attainment, sourced pipeline |
The real discipline is to keep old definitions from lingering after the business has moved on. A dashboard that was useful last year can become dangerous this year if nobody has checked whether its logic still matches the company. Governance, at its best, is simply the habit of making sure the numbers in the room still belong to the business as it exists today.
Metric definition drift is rarely caused by one careless dashboard or one analyst changing a formula in isolation. It usually appears because the company has grown faster than its shared business language.
The same words that once worked well in a smaller setup — lead, pipeline, revenue, churn, conversion, active customer — begin carrying more weight as teams, tools, products, regions, pricing models, and reporting needs expand. Marketing needs one lens. Sales needs another. Finance needs stricter treatment. Product and customer success need their own signals. The word stays familiar, but the business behind it has become more layered.
That is why drift is so dangerous. It creates the feeling of agreement while quietly removing the substance of agreement. Everyone enters the meeting believing they are discussing the same number, then the conversation slows because each team has brought a slightly different version of reality.
The argument may sound like a dashboard issue, but the real issue is language, ownership, and trust. A metric that is not clearly named, owned, and understood becomes a place where hidden assumptions collect.
The better answer is not to force every department into one flat number. Serious companies need different views of the business. Booked revenue, recognized revenue, collected revenue, net revenue, and recurring revenue can all matter.
Marketing-influenced pipeline and sales-forecast pipeline can both be useful. Product-active customers and billing-active customers can each tell a true story. The discipline is in naming those stories properly, deciding where each one belongs, and making sure no broad label pretends to mean everything.
Once that discipline exists, analytics becomes calmer and more useful. Leaders spend less time asking which number is right and more time asking what the number is revealing. Analysts spend less time defending extracts and more time explaining movement.
Teams can challenge performance without reopening the rules of the game in every review. AI tools can answer with better context because the company has already done the hard work of defining what its own words mean.
In the end, controlling metric drift is about protecting the company’s ability to think clearly. A growing business can live with multiple versions of a metric when those versions are named, governed, and used in the right places.
What it cannot afford is multiple departments quietly using the same word for different truths. That is where trust breaks — and that is where better metric language, ownership, and review habits give the business a stronger foundation for every decision that follows.
Metric definitions drift because departments use the same business words for different jobs. Marketing may use a metric to understand demand. Sales may use it to judge opportunity quality. Finance may use it to support forecasting, billing, or reporting discipline. Product may use it to understand behaviour. Customer success may use it to read renewal risk. The word stays the same because everyone wants a shared language, but the work behind the word keeps changing.
This is especially common in growing companies. In the early stage, people know what a lead, customer, revenue number, or churn number means because the same small group uses it every day. Later, new teams, new tools, new regions, new pricing models, and new reporting needs stretch those words. Drift begins when each team adjusts the metric for its own decision and the company does not update the shared meaning around it.
Metric drift is not always a sign that something is broken. Sometimes it is simply a sign that the business has become more complex. A company may start with one simple revenue number, then later need booked revenue, billed revenue, recognized revenue, collected revenue, recurring revenue, and net revenue. Those are not bad variations. They are different views of the business.
The problem begins when those variations are hidden under one loose label. If five teams all say revenue and each one means something different, the meeting becomes confused before the decision even begins. Healthy variation is named, owned, and used in the right place. Unhealthy drift hides inside dashboards, spreadsheets, CRM views, and old reporting habits until people discover too late that the numbers were never speaking the same language.
The business should own the meaning of the metric, while analytics should own the way that meaning is implemented in reports, models, and dashboards. A sales leader is usually better placed to define what a qualified opportunity means.
Finance should own stricter revenue, margin, cash, and reporting definitions. Product should help define meaningful usage. Customer success should help define renewal risk or account health. Analytics then turns those decisions into stable logic.
The mistake is leaving ownership on one side only. When business teams define metrics without analytics, the definition can become too loose to implement properly. When analytics defines metrics without business authority, the number may be clean but commercially wrong. The best ownership model is shared: the business decides what the metric should mean, analytics makes sure the metric behaves that way in the reporting system.
A dashboard can reduce confusion, but it cannot stop metric drift by itself. A dashboard only shows the number. It does not automatically decide what the number should mean, whether the definition is still current, or whether a local filter has become part of the business logic. That is why two dashboards can use the same label and still show different totals.
The dashboard becomes trustworthy when the metric behind it is owned, named properly, and connected to a current definition. A leadership dashboard needs more discipline than an exploratory team report because people use it for planning, forecasting, budget calls, performance reviews, and incentives.
Once a dashboard starts shaping real decisions, the metric inside it needs a clear purpose, a known source, visible exclusions, and a way to track changes over time.
Useful variation happens when different versions of a metric exist for clear reasons. Booked revenue can help sales understand closing performance. Recognized revenue can help finance report the accounting view. Product-active customers can help product teams understand usage. Billing-active customers can help finance or customer success understand commercial status. These versions can all be useful because they answer different questions.
Metric drift happens when those differences are left unnamed. If every report simply says revenue, customer, churn, or pipeline without explaining which version it means, people may believe they agree while reading the number differently. The issue is not that the business has multiple views. The issue is that those views need proper names, owners, and meeting contexts so the company knows which version belongs where.
Marketing and sales metrics drift because the handoff between demand and revenue has many stages. Marketing often looks at the first visible sign of interest: a form fill, webinar registration, content download, ad response, or demo request. Sales usually cares about whether that interest is worth pursuing: fit, intent, timing, budget, authority, and the chance of a real opportunity.
Both teams can be right from their own side of the funnel, but confusion starts when the same label is used for different stages. A “lead” in a campaign report may not be a “qualified lead” in a sales review. A “pipeline” number in a marketing report may not be the same as a forecast pipeline in a sales call. Better naming removes much of the tension because teams can see where demand was created, where it was accepted, and where it became commercially meaningful.
Finance usually looks at metric drift through the lens of control. Sales may want the latest bookings view, marketing may want campaign influence, and product may want usage signals, but finance has to think about period treatment, billing, recognition, margin, cash, and whether the number can stand up in a forecast or board review.
That does not make the finance version the only useful version. It simply means finance-linked metrics usually need tighter language. Bookings, billings, collections, recognized revenue, net revenue, and recurring revenue should not casually sit under one broad revenue label.
When the company separates operational momentum from finance-ready reporting, the conversation becomes much cleaner. Sales can discuss closing performance, marketing can discuss influence, and finance can protect the number used for planning and official reporting.
A metric is ready for executive reporting when people can explain it without opening five dashboards or asking three analysts for context. The name should be clear, the owner should be known, the source should be trusted, the calculation should be reusable, and the limits should be visible.
People should know which records are included, which are excluded, which date drives the reporting period, how often the number updates, and whether the definition has changed recently.
Executive reporting does not require every metric to be perfect. It requires the number to be stable enough for the decision attached to it. If leaders are going to use a metric for budget, forecast, hiring, incentives, product direction, or customer strategy, the definition needs more discipline than a casual team dashboard. A simple change history also matters because a number can look like performance has changed when the rule behind the number has changed.
Every important metric name should have one clear official meaning, but a company may still need multiple official variants. Revenue is the easiest example. Booked revenue, recognized revenue, collected revenue, net revenue, and recurring revenue can all be valid. Churn can also have different valid forms, such as logo churn, revenue churn, contraction, downgrade, and non-renewal.
The key is to stop vague labels from doing too much work. A dashboard that simply says revenue may create confusion if the room is not sure which revenue view it is using. A dashboard that says recognized revenue, booked revenue, or net revenue gives people the context upfront. The company does not need one flat number for every situation. It needs each version to be named clearly enough that nobody mistakes one business question for another.
Start with the metrics that already create arguments. Do not begin with every field, every report, or every dashboard. Pick the numbers that appear in leadership meetings, board decks, forecast calls, commission reviews, budget discussions, and campaign reviews. Revenue, pipeline, churn, qualified lead, conversion, retention, utilization, margin, and customer health are usually good places to look first.
Then map where those numbers currently live. Look at dashboards, CRM reports, finance sheets, board packs, spreadsheets, and team-specific views. The question is simple: are these truly different metrics, useful variants, old copies, or accidental duplicates?
Once that is clear, the business can approve the versions that should remain, rename the ones that need context, and retire the ones that create confusion. The fastest repair is usually not a giant governance programme. It is removing the recurring arguments around the few numbers that matter most.
Aug 04, 2026 / 27 min read

Aug 04, 2026 / 22 min read
Jul 31, 2026 / 24 min read