Why Marketing, Sales, And Finance Reports Do Not Match
Aug 04, 2026 / 27 min read
July 24, 2026 / 36 min read / by Team VE
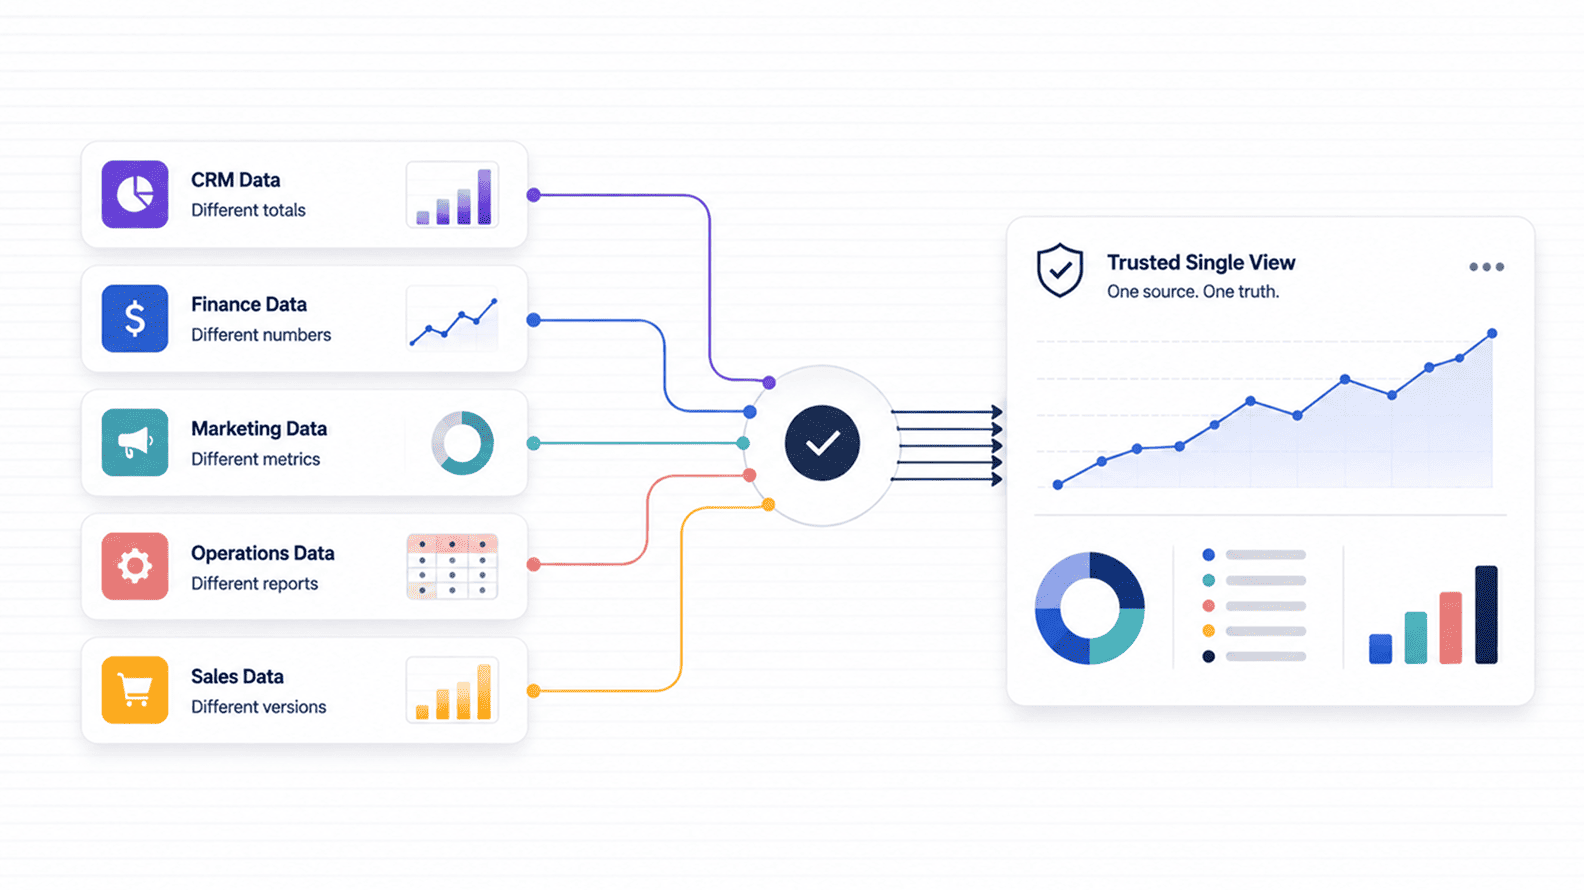
Analytics teams spend too much time reconciling numbers because modern companies run on systems that record the same business from different angles. CRM, billing, finance, marketing automation, product analytics, support tools, spreadsheets, and dashboards may all be capturing real activity, yet they often use different definitions, date fields, filters, refresh cycles, ownership rules, and manual adjustments.
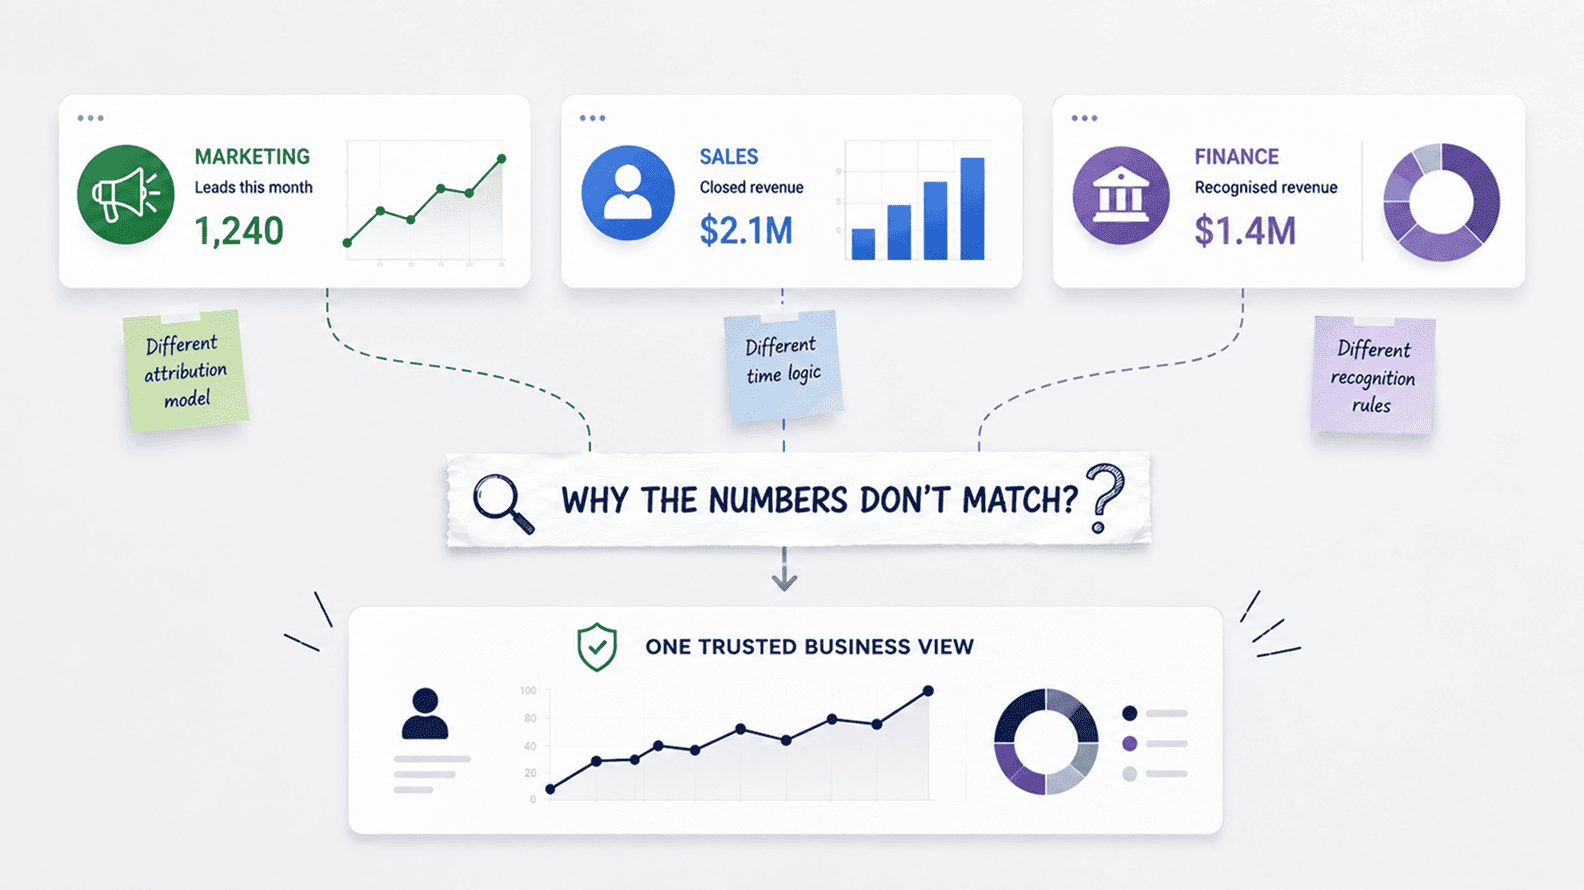
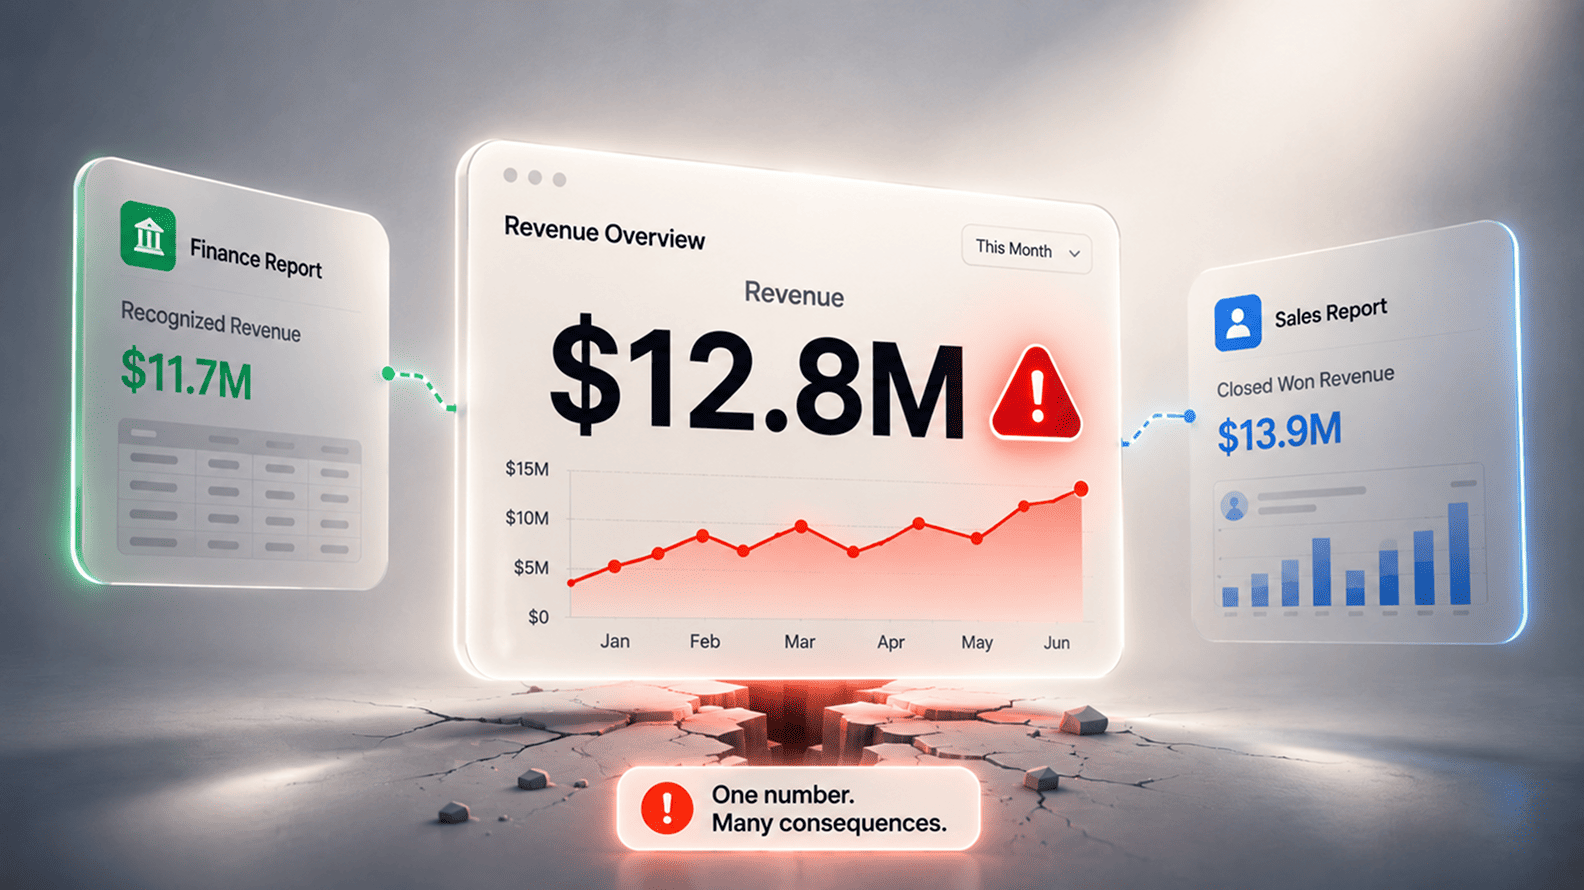
Revenue changes depending on whether a team is looking at bookings, invoices, collections, or recognized revenue. Leads change depending on whether marketing is counting form fills, sales is counting accepted opportunities, or finance is waiting for actual customers. The analyst’s work begins where these versions meet, because the business needs to understand the difference before it can trust the number.
The cost shows up in the pace and confidence of decision-making. Sales, finance, marketing, product, and operations can all arrive with evidence and still spend the meeting working through definitions instead of performance. Strong analytics teams reduce that confusion by making every important number easier to trace: where it comes from, what it includes, what it excludes, which date field it uses, how fresh it is, who owns it, and which decision it supports.
A mature analytics environment accepts that some numbers should differ because they describe different stages of the business, while making those differences visible enough that leaders can move from explanation to action without reopening the same debate every month.
Analytics reconciliation is the process of comparing numbers across source systems, dashboards, spreadsheets, business reports, and stakeholder-owned trackers so the company can understand why they differ, which version belongs to which decision, and what needs to be corrected, governed, documented, or explained before the business acts on the data.
In 2016, Facebook acknowledged a measurement issue in its average video-viewing metric: the calculation counted only people who watched for more than three seconds, which made the reported average viewing time look higher than it should have. Facebook’s video metric error captured the practical problem clearly: a metric that looked like a clean performance signal was shaped by a definition most advertisers would not naturally see inside the dashboard.
The issue later became part of advertiser litigation, and Facebook agreed to a $40 million settlement while denying wrongdoing. For analytics leaders, the lesson is direct: once a metric is used to judge performance, allocate budget, or defend a decision, the calculation behind it carries commercial weight.
Most companies face a quieter version of this problem inside routine review meetings. There are dashboards on the screen, CRM exports in circulation, finance packs from accounting, campaign sheets from marketing, product charts from analytics, and operational trackers maintained by delivery or support.
Sales may be looking at booked value, finance may be working from recognized revenue, marketing may be reporting lead volume, sales operations may be focused on qualified pipeline, product may be showing activity, customer success may be watching renewal-risk accounts, and operations may be tracking utilization. Each team is describing a real part of the business, but the meeting still has to pause because those realities have not yet been joined into one trusted view.
That is where reconciliation begins. The analyst is usually tracing the business meaning behind the number: which system produced it, which date field controls it, which records were included, which rules were applied, when the data last refreshed, and which version belongs to the decision in front of the room.
Revenue can mean booked, billed, collected, deferred, recognized, recurring, gross, net, or adjusted. A lead can mean a form fill, contact, MQL, SQL, opportunity, or accepted sales lead. A customer can mean user, account, payer, workspace, parent company, subsidiary, or legal entity.
The reconciliation burden grows because systems are built for different operating jobs before they are connected into a shared reporting language. A CRM helps sales manage pipeline, a billing platform issues invoices, a finance system protects accounting control, a product analytics tool records behaviour, a support desk manages tickets, and a marketing platform tracks campaign activity.
Each system can be useful inside its own workflow, while still creating friction when leadership wants one clean picture across the company. As dashboards, spreadsheets, manual corrections, and local trackers multiply, analytics teams spend more time reconnecting meaning before the business can make a confident decision.
A large share of reconciliation work begins when different teams are looking at the same business journey from different positions. Revenue is the easiest example because the word sounds simple in a meeting, while the operating reality behind it can pass through contract signing, invoicing, delivery, collection, credits, cancellations, and recognition.
Sales may be focused on booked value because it reflects commercial momentum, billing may be looking at invoices raised, cash teams may care about money collected, and finance may rely on recognized revenue because accounting standards such as IFRS 15 Revenue from Contracts with Customers link revenue reporting to the transfer of promised goods or services and the satisfaction of performance obligations.
The same pattern appears in the funnel. Marketing may count demand at the point of capture, such as a form fill, event registration, webinar attendee, demo request, or content download. Sales may care about a later moment, when that person becomes accepted, qualified, attached to an opportunity, or tied to a real buying conversation.
Finance enters much later, when the opportunity turns into revenue. The numbers can all be useful, but they create friction when everyone uses one broad lead label for several different stages of intent, qualification, and commercial value.
Customer count creates an even messier version of the same issue. A product team may count users because product adoption depends on people taking action inside the software. Finance may count paying entities because invoices, contracts, and revenue live at that level. Sales may count accounts because relationship ownership sits there.
Customer success may care about contracted customers, parent companies, or renewal groups because that is how risk and responsibility are managed. In SaaS, marketplaces, outsourcing, healthcare, education, and multi-location businesses, one customer can easily become several units depending on the decision being made.
Analytics teams spend hours reconciling these numbers because the disagreement is often legitimate before it becomes confusing. Booked value, billed value, collected cash, and recognized revenue describe different moments.
Raw leads, MQLs, SQLs, and opportunities describe different levels of intent. Users, accounts, payers, and legal entities describe different units of customer reality. The work becomes painful when dashboards compress those distinctions into one loose metric name and leave the analyst to explain the difference in the middle of a review.
A stronger analytics setup names the moment being measured before the number enters the meeting:
| Business Term | What Different Teams May Mean | Cleaner Metric Language |
| Revenue | Closed deal, invoice raised, cash collected, revenue recognized, net of refunds, recurring revenue. | Booked revenue, billed revenue, collected cash, recognized revenue, net revenue, ARR or MRR. |
| Lead | Form fill, contact, MQL, sales-accepted lead, SQL, opportunity. | Raw inquiry, valid lead, MQL, SAL, SQL, opportunity created. |
| Customer | User, account, payer, workspace, parent company, legal entity, active subscriber. | Active user, paying account, billing entity, parent account, contracted customer. |
| Active Usage | Login, any event, meaningful feature action, paid usage, non-internal activity. | Login activity, product event activity, value-action usage, qualified active user. |
| Churn | Cancelled user, lost account, revenue contraction, non-renewal, downgrade. | Logo churn, revenue churn, gross churn, net churn, contraction, non-renewal. |
Date fields create reconciliation work because they decide when a record belongs to a reporting period. A lead may be created in January, accepted by sales in February, converted into an opportunity in March, closed in April, invoiced in May, and recognized later depending on delivery or accounting rules. Each team may be using a sensible date, yet the numbers will drift the moment those views are compared inside one monthly review.
Revenue is usually where this becomes visible first. Sales may report by close date because that captures commercial momentum, billing may report by invoice date because that is when the customer was charged, finance may report by recognition period because revenue has to follow accounting treatment, and cash teams may report by payment date because money has actually arrived.
The same pattern appears in lead reporting, where marketing may use form-submission date while sales uses qualification date, which means a January campaign can continue producing pipeline in February or March even when the marketing dashboard has already moved on.
| Metric | Date Fields That Often Cause Disputes | What Teams Need To Know |
| Revenue | Close date, invoice date, payment date, service start date, recognition period. | Whether the report is showing sales momentum, billing activity, cash movement, or finance reporting. |
| Leads | Created date, campaign response date, MQL date, SQL date, opportunity-created date. | Whether the report is measuring demand capture or sales-qualified movement. |
| Customers | Signup date, first payment date, contract start date, activation date, renewal date. | Whether the report is counting acquisition, payment, activation, or commercial relationship. |
| Product Usage | Event date, ingestion date, processing date, value-action date. | Whether the report follows user behaviour or system processing. |
Current-period reporting adds another layer because the month is still changing while teams are already discussing performance. Some records arrive late, some systems refresh overnight, some finance numbers remain provisional until close, and some CRM or marketing records are backfilled after teams clean up their data.
A number can be accurate at the moment it loads and still create confusion later if users cannot see what has refreshed, what is provisional, and which date field controls the view.
Good reconciliation starts with the date logic before the number itself. Once the business knows whether it is comparing close date with recognition period, form-submission date with qualification date, or signup date with activation date, many disputes become easier to settle because the difference has a business explanation rather than a reporting mystery.
Even when teams agree on the metric and the reporting period, numbers can still drift because every report is shaped by scope. One dashboard includes test records, another removes them. One lead report counts every form submission, another removes duplicates.
One revenue view shows gross value, another subtracts refunds, credits, cancellations, or write-offs. One product dashboard includes internal users, another excludes employees, bots, test accounts, or low-quality events. The difference may come from a sensible rule, but the rule still has to be visible because users rarely see the filters that shaped the number.
Marketing analytics gives a familiar example. Google’s own documentation for GA4 data filters explains that an exclude filter permanently removes matching event data from processing, while report filters only hide data from specific reports.
That distinction can easily create reconciliation work if one team is comparing raw platform data, another is using a dashboard with report filters, and a third is looking at exported data after exclusions have already been applied. The numbers may all come from the same ecosystem, yet they will not behave like the same number if the scope rules are different.
Manual rules add another layer. Finance may keep an adjustment sheet for corrections that have not yet moved into the source system. Marketing may maintain a campaign mapping file because naming conventions changed halfway through the quarter. Sales operations may clean pipeline stages manually after a CRM migration.
Operations may track utilization outside the official tool because the tool does not reflect the way work is actually assigned. These sheets often contain genuine business knowledge, which is why people trust them, but they also create a parallel layer of logic that analysts have to trace whenever dashboard numbers are challenged.
| Hidden Rule | How It Changes The Number | Reconciliation Question |
| Test or internal records excluded | Removes activity that exists in the source but should not count for performance. | Which reports exclude internal, test, bot, or demo records? |
| Duplicate records removed | Changes totals for leads, customers, tickets, invoices, or users. | Where does deduplication happen, and what is the matching rule? |
| Refunds or cancellations deducted | Converts gross value into net value. | Is the business discussing gross, net, adjusted, or final value? |
| Campaign mapping corrected manually | Reassigns performance across channels, sources, or campaigns. | Is the mapping governed, current, and visible to every report? |
| Manual finance adjustment applied | Changes the number after source-system data has landed. | Is the adjustment documented, approved, and included in the official model? |
The fix is to treat filters, exclusions, and manual rules as part of the metric definition rather than as small implementation details. A dashboard that excludes refunds, inactive accounts, spam leads, internal traffic, duplicate contacts, test records, or provisional transactions should make those choices clear enough that a business user can understand the number without calling an analyst into every meeting. Reconciliation becomes much lighter when people can see not only the final total, but also the rules that shaped it.
Reconciliation becomes heavier when dashboards multiply faster than governance. It usually starts with sensible demand. Sales needs a pipeline view, marketing needs campaign performance, finance needs revenue reporting, operations needs workload visibility, and customer success needs renewal risk.
Then come regional versions, leadership versions, manager versions, Monday-review versions, board-pack versions, and quick copies made for one urgent question. Many of these reports solve a real need when they are created, but the company rarely retires the old ones with the same discipline.
After a while, several dashboards carry similar names while using slightly different logic. One revenue dashboard may come directly from the CRM, another from the warehouse, another from a finance extract, and another from a copied report that was built before the latest metric change.
They all look official enough to be used in a meeting, especially when they sit inside the same BI tool with the same charts, logos, and polished formatting. The dispute begins when two people open different reports and both believe they are using the company’s approved number.
This is where certification becomes practical rather than cosmetic. Microsoft’s guidance on endorsing Power BI and Fabric content describes certification as a way to help users identify trustworthy, high-quality content, while Tableau’s data quality warnings give teams a way to flag assets that may be stale, deprecated, incomplete, or unsuitable for use.
These controls matter because business users need visible signals inside the analytics environment itself, not a separate governance policy that nobody checks before a review.
| Dashboard Problem | What It Creates | Better Control |
| Several reports use the same metric name | Users compare numbers that were built for different decisions. | Certified dashboard for each critical decision area. |
| Old reports remain available | Deprecated logic keeps resurfacing in meetings. | Retirement rules, archive labels, and clear replacement links. |
| Personal views look official | Working analysis becomes company truth by accident. | Promoted, certified, exploratory, and draft labels. |
| Refresh status is unclear | Users treat stale numbers as current. | Visible freshness indicators and data quality warnings. |
| Metric logic changes quietly | Teams keep using dashboards built on older definitions. | Change logs, owner approval, and dashboard impact reviews. |
The aim is to make authority visible. Different teams will always need different views, but every view should not carry the same weight. A sales manager’s working dashboard, a finance-certified revenue report, an exploratory campaign analysis, and an executive KPI pack should not appear equally official to the business.
When the analytics environment marks which reports are certified, which are exploratory, which are deprecated, and which are under review, users spend less time asking which number to trust.
Good governance also reduces repeated investigation. If a dashboard uses a close date while the finance report uses a recognition period, the difference should be documented where users encounter the report. If one view shows gross revenue and another shows net revenue, the label should say so clearly.
If a report has not refreshed, the warning should appear before the number enters a leadership conversation. Reconciliation becomes manageable when people know which dashboard is official for which decision, and when older or local versions cannot quietly compete with the trusted view.
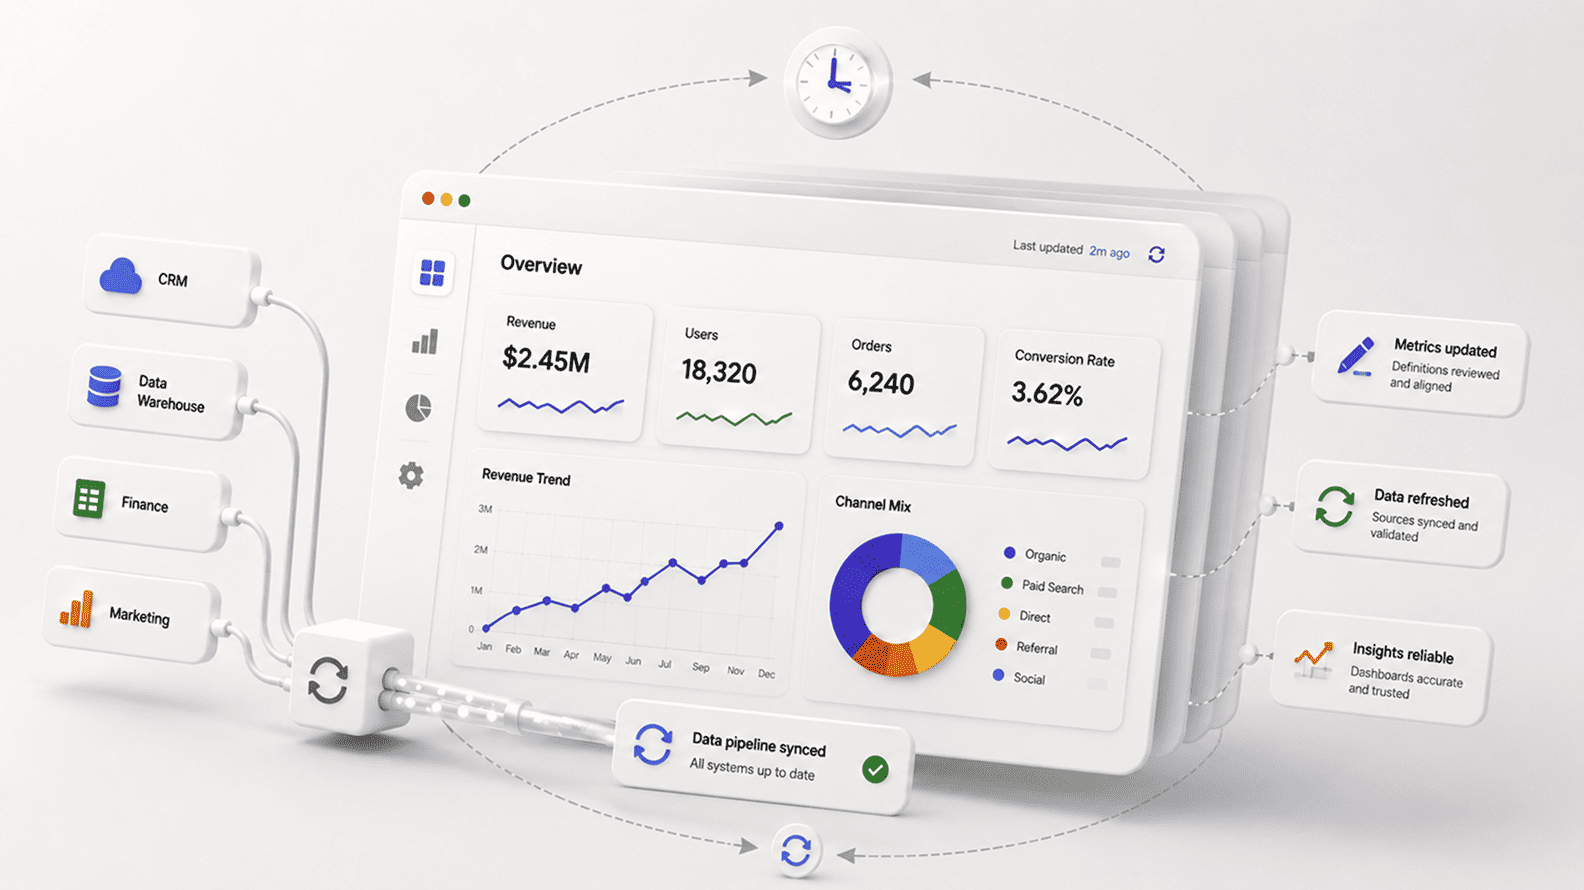
Some reconciliation work begins with perfectly valid numbers that belong to different moments in time. A dashboard may refresh at 9 a.m., while the CRM table behind it last loaded at midnight, billing data refreshes once a day, product events stream throughout the day, marketing attribution settles later, and finance adjustments are still provisional until the month is closed.
When these sources appear together in one dashboard, users often assume they are looking at one current business picture, although the report may actually be stitching together several reporting moments.
This creates unnecessary doubt. Sales sees a deal in the CRM and asks why it has not appeared in the dashboard. Finance sees a payment clear and asks why the revenue view has not moved. Marketing sees form submissions in the campaign tool and asks why CRM reporting is lower.
Product sees early usage after a release and wonders why the executive dashboard still looks flat. In many cases, the answer is not a broken metric or a flawed dashboard; the data has simply not arrived, transformed, refreshed, or passed through the relevant business rule yet.
Freshness has to be visible because trust is time-sensitive. A number that was correct yesterday may be too old for today’s decision, while a current source table may still sit beside another source that updates only after approval or close.
Tools such as dbt source freshness are useful because they encourage teams to track when source data was last loaded instead of assuming that a dashboard refresh means every underlying source is equally current. The important habit is broader than any one tool: users should be able to see when the data last changed, whether the number is provisional, and which sources are still waiting on late-arriving records.
| Freshness Problem | What Users See | What Should Be Visible |
| Dashboard refreshed before source data arrived | The report loads, but the number feels behind the source system. | Last successful source update and pipeline status. |
| Finance data is still provisional | Current-month revenue, margin, or cost keeps changing. | Provisional label, close calendar, and finalization date. |
| Marketing attribution is still settling | Campaign numbers shift after the first report. | Attribution window and expected update lag. |
| CRM or product records are backfilled later | Earlier periods change after users clean up records or events arrive late. | Backfill notes and affected reporting window. |
| Mixed refresh schedules sit in one dashboard | Users compare numbers as if every source updated together. | Source-level freshness timestamps, not only dashboard refresh time. |
A lot of reconciliation time disappears when the dashboard tells users what stage the data is in before they challenge the number. A current-month view can remain useful for monitoring, while still being labelled as moving. A finance number can remain trusted, while still being marked as pre-close.
A campaign report can be helpful early in the week, while still showing that attribution may change. Reconciliation becomes calmer when freshness is treated as part of the metric experience, rather than as a hidden technical detail analysts have to explain after confusion has already entered the room.
Reconciliation is easy to underestimate when it is treated as analyst clean-up work. A few hours spent comparing a dashboard with a spreadsheet may look like a normal part of reporting, especially in a busy company with several systems and fast-moving teams.
The larger cost appears later, when leaders begin asking for manual confirmation before trusting dashboards, managers bring their own trackers to reviews, finance becomes the only team whose number carries authority, and analysts are pulled into meetings mainly to explain why two reports disagree.
That confidence loss changes the way the business behaves around data. Sales reviews slow down because pipeline and revenue need to be rechecked. Marketing decisions become cautious because lead quality and source attribution are still being debated.
Operations teams hesitate to act on utilization or delivery numbers because the tracker and dashboard do not align. Finance teams spend extra time validating numbers that should already be clear. Analysts become interpreters of the scoreboard instead of partners in improving performance.
The concern is serious enough that data governance has moved from a technical discipline into a business operating issue. Gartner’s data governance guidance frames governance around decision rights and accountability, with the aim of improving data accuracy, reducing decision-making time, and managing risk through clearer control of data and analytics assets.
That is exactly the pressure reconciliation exposes. When the company has no agreed owner, definition, refresh rule, or trusted report for a metric, every disagreement becomes a fresh investigation.
| Where The Cost Shows Up | What The Business Feels | What Analytics Teams End Up Doing |
| Leadership reviews | Meetings slow while teams confirm which number can be trusted. | Trace sources, filters, definitions, and refresh timing live or after the meeting. |
| Finance close and reporting | Numbers need repeated checking before they are used outside the team. | Compare dashboard output with accounting files, adjustment sheets, and approved close logic. |
| Sales and marketing alignment | Funnel performance becomes a debate over lead and opportunity definitions. | Reconcile CRM, campaign tools, lifecycle stages, duplicates, and attribution rules. |
| Operations management | Utilization, workload, staffing, or delivery numbers feel uncertain. | Compare system records with timesheets, trackers, manual corrections, and manager updates. |
| Analyst capacity | Strategic analysis gets pushed behind recurring number checks. | Repeat investigations that should have become documented rules or governed models. |
The most expensive reconciliation work is the work that keeps returning. A one-time investigation can be useful because it teaches the business something about its systems. A recurring mismatch shows that the company has left the lesson unfinished. If the same revenue gap appears every month, the definition needs ownership.
If the same lead dispute appears every campaign review, the funnel stages need agreement. If the same dashboard needs an analyst explanation before every meeting, the report needs clearer labels, documentation, freshness signals, or certification.
A company with strong analytics discipline still reconciles numbers, but it does not rediscover the same differences endlessly. It records what was learned, updates the metric definition, clarifies the owner, improves the dashboard label, retires the confusing report, or moves the manual rule into a governed model. That is how reconciliation becomes a path toward trust rather than a permanent tax on every decision.
A number mismatch is useful when the company treats it as a clue. Sales and finance revenue may differ because both teams are reading different stages of the revenue journey. Marketing and CRM leads may differ because one report counts demand capture while the other follows qualification.
Active users may differ because one dashboard counts every event and another counts meaningful usage after bot, employee, or test activity has been removed. These gaps waste time when they are rediscovered every month, but they become valuable once analytics teams record what the mismatch reveals and turn that learning into clearer metric ownership.
| Reconciliation Signal | What It Often Reveals | What The Business Should Do Next |
| Sales and finance revenue do not match | Bookings, billings, collections, and recognized revenue are being discussed under one broad revenue label. | Name each revenue stage clearly and assign finance ownership for official reporting definitions. |
| Marketing leads and CRM leads differ | Form fills, duplicates, lifecycle stages, campaign-source rules, or sales-acceptance logic are being counted differently. | Separate raw demand, valid leads, MQLs, SQLs, and opportunities in the funnel model. |
| Active users differ across reports | Event definitions, identity stitching, internal-user exclusions, bot filters, or time windows vary. | Define the value action that counts as meaningful activity for product and customer decisions. |
| Customer count changes by department | User, account, payer, workspace, parent-company, and legal-entity logic are being mixed. | Choose the right customer unit for each decision and make that unit visible in reports. |
| Dashboard total differs from exported data | Filters, hidden exclusions, stale refreshes, row-level grain, or transformation logic differ. | Show filters, freshness, grain, and calculation logic close to the metric. |
| Numbers change after a CRM, website, or product update | Source fields, tags, forms, stages, events, or schemas changed upstream. | Add change notification and impact review before reporting users see unexplained movement. |
| One team maintains a private tracker | Official systems do not reflect the business logic people rely on in daily work. | Govern the tracker, replace it, or move the trusted logic into the reporting layer. |
The best response is to build memory into the analytics operating model. A mismatch that has been explained once should not return as a fresh mystery in the next review. The cause should feed a metric dictionary, dashboard note, certified report label, source-system rule, glossary term, or owner decision.
Microsoft Purview’s guidance on glossary terms in Unified Catalog is useful because it treats business terms as governed context that can be connected to data products, assets, columns, and critical data elements. That is the level of connection reconciliation needs. The business term should not live in a forgotten document while the dashboard, source table, and spreadsheet all carry different logic.
This is where good analytics teams become more than report builders. They turn repeated disputes into operating clarity. If the same revenue gap returns every month, the team does not merely explain it again; it clarifies the revenue stages and points users to the certified source. If the same lead mismatch appears after every campaign, the funnel definition needs cleanup.
If product and customer success keep debating activity, the company needs an agreed usage definition linked to the decisions it supports. Reconciliation becomes far less painful when every recurring mismatch leaves the system more understandable than it was before.
The goal of reconciliation is clarity. Bookings and recognized revenue should differ when they describe different stages of the commercial journey. Raw leads and sales-qualified opportunities should differ when the funnel is doing real qualification work.
Active users and paying customers should differ when product engagement and commercial relationship are being measured separately. A business creates confusion when these numbers differ without explanation, ownership, or visible logic.
Strong analytics teams build a controlled way to explain those differences before meetings turn into investigations. The useful question becomes simple: does the difference come from a valid business definition, a timing gap, a filter, a refresh delay, a manual adjustment, or an actual error? Once that cause is known, the team can decide whether the metric needs clearer labelling, a certified dashboard, a glossary entry, an owner, a source fix, or a change in how the number is used.
| Type Of Difference | What It Means | How Analytics Should Handle It |
| Valid business difference | Two numbers describe different stages, such as bookings and recognized revenue. | Label both clearly and define which decision each supports. |
| Timing difference | Data belongs to different dates, refresh cycles, or close periods. | Show date logic, freshness, and provisional status near the metric. |
| Scope difference | Filters, exclusions, duplicates, segments, or business rules vary. | Document the inclusion and exclusion rules inside the report or metric dictionary. |
| Manual adjustment | A spreadsheet or stakeholder rule changes the system number. | Govern the adjustment, assign ownership, and decide whether it belongs upstream. |
| Actual data error | Records are missing, duplicated, mapped incorrectly, or transformed wrongly. | Fix the source, pipeline, or model and record the cause so it does not return. |
| Legacy report difference | An old dashboard uses outdated logic but remains available. | Archive, label, or redirect users to the certified report. |
This is where a metric dictionary becomes more than documentation. It should give users the business name of the metric, the calculation, the source system, the date field, the refresh rhythm, the owner, the exclusions, the caveats, and the report that carries official authority. A strong analytics function still investigates mismatches, but each investigation should leave behind a clearer system.
The same gap should not return every month as if nobody has seen it before. Once the cause is understood, the definition should improve, the dashboard should become clearer, the owner should be named, or the logic should move into a governed model. Over time, reconciliation shifts from repeated clean-up to accumulated business knowledge. That is how analytics teams protect trust without pretending every number has to collapse into one universal total.
Reconciliation has a useful role when it helps the company understand how its numbers are built. A revenue gap can teach the business how bookings, invoices, collections, and recognition move through different systems. A lead mismatch can reveal where marketing demand becomes a sales-qualified pipeline.
A customer-count dispute can force the company to decide whether it is counting users, payers, accounts, legal entities, or renewal groups. Done well, reconciliation becomes a learning loop that improves the reporting system after every dispute.
The problem begins when the same explanation has to be rebuilt again and again. If analysts are still explaining the same revenue mismatch every month, the company needs clearer metric ownership. If the same dashboard needs verbal caveats before every leadership meeting, those caveats belong inside the reporting experience.
If one team’s spreadsheet keeps correcting the official number, the trusted logic inside that file needs governance, documentation, or migration into the analytics layer. Reconciliation should reduce future confusion, not become the permanent bridge between disconnected systems.
A healthier model gives each important metric a small operating record. The business should know the approved definition, source system, owner, date field, refresh rhythm, key filters, exclusions, caveats, certified report, and escalation route. This does not require a heavy governance programme at the start.
It can begin with the numbers that carry the most decision risk: revenue, margin, pipeline, leads, churn, customers, utilization, product usage, campaign performance, and cash collection. These are the numbers that slow meetings when they are unclear, so they deserve the first layer of discipline.
| Metric Control | What It Should Clarify | Why It Reduces Reconciliation |
| Business Definition | The exact event, stage, or unit being measured. | Teams stop using one familiar word for several different realities. |
| Source Of Authority | The system or model that owns the official number. | Users know which report belongs to the decision. |
| Date Logic | The date field that places records into periods. | Month-end and current-period disputes become easier to explain. |
| Inclusion Rules | Filters, exclusions, deduplication, and adjustment logic. | Hidden scope differences stop becoming surprises. |
| Freshness Status | Last update, refresh rhythm, and provisional status. | Users know whether the number is current, final, or still moving. |
| Metric Owner | The person or function accountable for meaning. | Analysts no longer carry business-definition disputes alone. |
A mature business still allows numbers to differ when they describe different stages of reality. Sales can use bookings, finance can use recognized revenue, marketing can use raw demand, sales operations can use qualified pipeline, and product can use meaningful activity.
The improvement comes from making those differences visible, named, owned, and repeatable. Once that happens, analytics teams can spend less time defending the scoreboard and more time helping the business understand performance, risk, opportunity, and the next decision.
Reconciliation becomes exhausting when the company keeps rediscovering the same differences without turning them into shared rules. A revenue mismatch should eventually teach the business how bookings, invoices, collections, adjustments, and recognized revenue move through different systems. A lead mismatch should sharpen the funnel language between marketing and sales.
A customer-count dispute should force clarity on whether the business is counting users, accounts, payers, parent companies, or contracted relationships. When the same explanation returns every month, the analytics team is carrying a governance gap that the business has not yet closed.
The healthiest companies treat reconciliation as a way to build operating memory. Once a mismatch is explained, the learning should appear somewhere useful: the metric definition, dashboard label, certified report, data catalog, meeting pack, source-system rule, or owner decision.
If the current-month revenue number is provisional, users should see that before they challenge it. If a campaign report excludes duplicates and test leads, the report should say so. If finance owns the recognized revenue view and sales owns the bookings view, both should be named clearly enough that leadership does not ask the same question again next month.
This discipline does not require a massive governance programme at the beginning. It can start with the numbers that already create the most friction: revenue, margin, pipeline, leads, customers, churn, product usage, utilization, campaign performance, and cash collection.
For each metric, the company should know the approved definition, source of authority, date logic, filters, exclusions, freshness status, owner, and certified reporting view. That small amount of structure removes a large amount of meeting-room confusion.
Analytics teams will always reconcile numbers because business reality is complex. Different systems will keep measuring different moments, and different teams will keep needing different views. The improvement comes when those differences become visible, named, owned, and repeatable.
Once the company knows why its important numbers differ, analysts can spend less time defending the scoreboard and more time helping leaders understand performance, risk, opportunity, and what should happen next.
Analytics teams spend so much time reconciling numbers because different systems often describe the same business process from different angles. CRM may show sales activity, finance may show recognized revenue, billing may show invoices, marketing automation may show campaign responses, product analytics may show usage, and spreadsheets may carry manual corrections or local business rules. Each source can be useful, yet the numbers drift when the company compares them without shared definitions, date logic, filters, and ownership.
The heavier burden comes from repeated ambiguity. Revenue, leads, customers, churn, active users, utilization, and margin sound simple in conversation, but they often carry different meanings across departments. Analysts have to trace the source, calculation, reporting period, refresh timing, exclusions, and business rules before leaders can decide which number belongs to the decision. Reconciliation becomes lighter when the business stops relying on analyst memory and gives every important metric a clear definition, owner, source of authority, and visible caveats.
Sales and finance numbers usually differ because they measure different stages of the revenue journey. Sales often focuses on bookings or closed-won value because that shows commercial momentum and team performance. Finance may focus on invoiced, collected, deferred, or recognized revenue because reporting has to follow accounting rules, contract terms, delivery timing, adjustments, and close processes. Both views can be valid, but they should not be treated as one interchangeable revenue number.
A mature reporting setup names each stage clearly. Booked revenue, billed revenue, collected cash, recognized revenue, ARR, MRR, gross revenue, net revenue, and margin all answer different questions. When these labels are precise, the meeting becomes easier because sales can talk about momentum, finance can talk about reporting discipline, and leadership can understand how the two connect. The problem begins when dashboards shorten all of that into revenue and leave analysts to explain the gap every month.
Marketing and sales lead numbers differ because the two teams often measure different levels of intent. Marketing may count form submissions, content downloads, webinar registrations, paid campaign responses, or new contacts. Sales may count accepted leads, qualified leads, meetings booked, opportunities created, or pipeline value. These are different stages of the same funnel, and each stage has a business purpose.
The fix is to stop treating lead as one loose number. A better funnel separates raw inquiry, valid lead, MQL, sales-accepted lead, SQL, opportunity, customer, and revenue. Once those stages are agreed, marketing can be judged on demand quality and source performance, while sales can be judged on qualification, follow-up, conversion, and pipeline movement. Reconciliation becomes far easier when the company can see where demand was captured, where it was qualified, and where it became commercially meaningful.
A dashboard may differ from the source export because the dashboard often applies transformations the raw export does not show. It may remove duplicates, exclude test records, filter out internal users, join records from another system, map old campaign names to new ones, convert gross value into net value, apply date logic, or refresh on a different schedule. The dashboard can be doing the right thing and still look different from the export.
The important question is whether the difference is visible and documented. Users should know which records are included, which are excluded, which date field controls the view, when the data refreshed, and which source or model owns the official number. A dashboard that differs from the source can still be trusted when the logic is clear. A dashboard that differs without explanation will keep pulling analysts into avoidable reconciliation work.
Current-month numbers keep changing because the month is still in motion while teams are already using the data. Leads may qualify after they are created. Deals may close near month-end but get invoiced later. Payments may arrive after the first report. Product events may load late. CRM records may be cleaned after a review. Finance may apply adjustments during close. Marketing platforms may revise attribution after more signals come in.
Current-period reporting should therefore be labelled carefully. A number can be useful for monitoring without being final enough for a hard decision. Dashboards should show freshness, provisional status, refresh timing, close calendars, and late-arriving data where relevant. Many arguments disappear when users can see whether they are looking at a final number, a moving number, or a partial view that still needs time to settle.
Reconciliation is sometimes a data quality problem, but many mismatches come from valid business differences. Duplicate records, missing fields, stale refreshes, broken mappings, bad joins, and incorrect transformations are real data quality issues. Bookings differing from recognized revenue, raw leads differing from SQLs, and users differing from paying accounts are usually expected differences because they describe separate moments or units.
Good analytics teams separate valid difference from actual error. If two numbers differ because they support different decisions, the job is to label, document, and govern them properly. If they differ because something is broken, the job is to fix the source, pipeline, model, or report. Reconciliation becomes productive when it leads to clearer definitions, better ownership, cleaner dashboards, and fewer repeated disputes.
Companies can reduce reconciliation work by starting with the metrics that create the most meeting-room friction. Revenue, margin, pipeline, leads, customers, churn, product usage, utilization, campaign performance, and cash collection usually deserve the first round of discipline. Each one should have a definition, owner, source of authority, date logic, filters, exclusions, refresh rhythm, certified report, and escalation path.
The second step is to record what analysts learn during reconciliation. If the same mismatch has been explained once, it should become part of the metric dictionary, dashboard label, report note, source rule, or governance decision. Old dashboards should be retired, private trackers should be reviewed, manual adjustment sheets should be governed, and recurring logic should move into trusted models. The aim is simple: every reconciliation exercise should make the next one shorter.
A metric dictionary gives the business one place to understand what a number means. It should explain the metric name, business definition, calculation logic, source system, owner, date field, refresh rhythm, filters, exclusions, caveats, and official reporting view. Without that shared reference, analysts are forced to reconstruct meaning every time a dashboard, export, spreadsheet, or stakeholder report disagrees.
A good metric dictionary also protects teams from using familiar words too loosely. Revenue becomes booked revenue, recognized revenue, collected cash, or net revenue. Leads become raw inquiries, MQLs, SQLs, or opportunities. Customers become users, accounts, payers, or legal entities. That clarity makes reconciliation less personal because the argument moves away from whose report is right and toward which metric belongs to the decision.
Private spreadsheets make reconciliation harder because they often contain business logic that official systems do not show. A workbook may include manual corrections, campaign mappings, finance adjustments, client notes, exclusions, pricing rules, staffing assumptions, or forecast changes. People may trust the spreadsheet because it reflects ground reality, but the logic becomes risky when it is undocumented, manually refreshed, and owned by one person.
The right response depends on the importance of the file. A temporary analysis can remain lightweight. A recurring workbook used for leadership reporting, finance review, sales forecasting, operational planning, or client decisions needs control. The company should connect it to trusted data where possible, document the logic, assign an owner, manage versions, and move stable high-risk rules into a governed model or workflow.
The best way to handle a mismatch in a meeting is to slow the argument and identify the mechanics behind each number. The team should check the metric definition, source system, date field, reporting period, filters, exclusions, refresh timing, manual adjustments, and dashboard authority before deciding which number belongs to the decision. Most disputes become clearer once those details are visible.
The more important habit comes after the meeting. Once the cause is known, it should be documented where people will actually see it next time. The dashboard label may need to change, the metric dictionary may need an update, the old report may need to be retired, or the owner may need to approve a definition. Reconciliation should leave the business with clearer operating memory, so analysts are not forced to solve the same puzzle again in the next review.
Aug 04, 2026 / 27 min read
Aug 04, 2026 / 22 min read
Jul 31, 2026 / 24 min read