Why Marketing, Sales, And Finance Reports Do Not Match
Aug 04, 2026 / 27 min read
June 26, 2026 / 27 min read / by Team VE
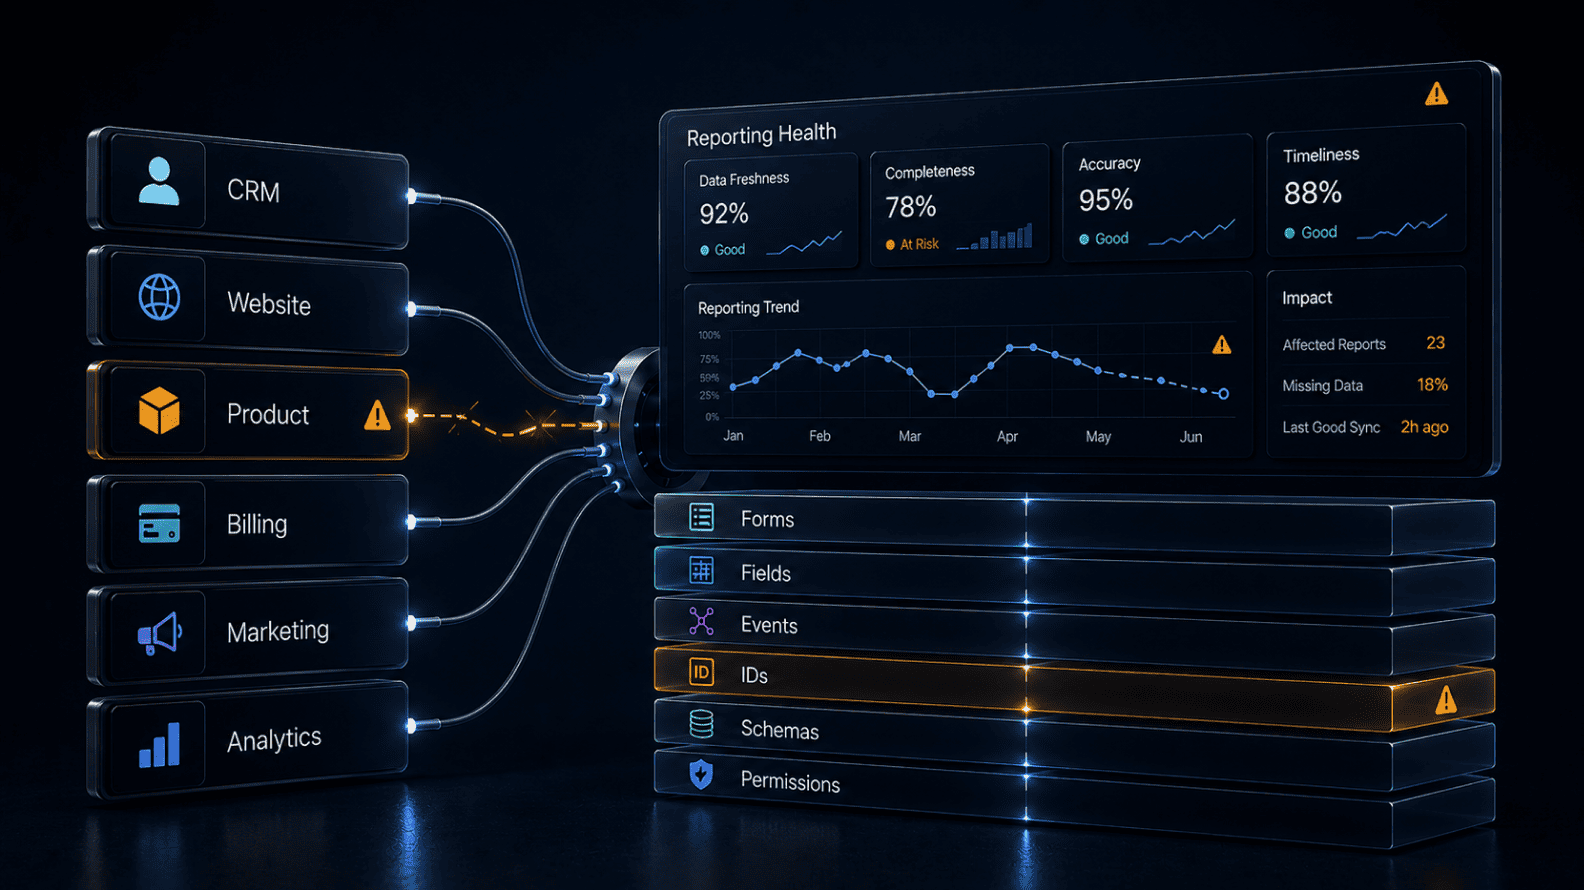
Reporting stays reliable only when product, CRM, website, billing, and analytics teams treat every operational change as a possible change to the measurement system as well.
Reporting breaks after product, CRM, or website changes because dashboards depend on a quiet chain of forms, fields, events, tags, IDs, schemas, permissions, statuses, and business rules that most users never see.
A website form can keep sending leads to sales while dropping campaign source data, a product release can improve onboarding while renaming the event that proves activation, and a CRM cleanup can make life easier for sales while breaking the field references that feed pipeline reporting. The visible system keeps working, but the evidence the business relies on becomes thinner, delayed, duplicated, or misclassified.
The best companies prevent this by bringing analytics into the release process. They keep field maps, tracking plans, event catalogs, schema monitors, source ownership, lineage views, dashboard change logs, and post-release validation close to the teams that change the systems.
The aim is simple and practical: when the business changes the way work happens, reporting must change with it, otherwise leaders can mistake measurement movement for business movement.
Reporting breaks after product, CRM, or website changes when an operational update changes the data structure, tracking behavior, field logic, event flow, source-system permission, or business rule that a dashboard depends on.
The product, CRM, website, or billing system may still work well for the team using it, while the analytics layer receives missing data, renamed data, delayed data, duplicated data, or data that no longer fits the old reporting logic.
A good website team looks at a lead form and sees friction. The form asks for too much, loads slowly on mobile, or loses prospects before submission, so the team simplifies the flow, moves the form into a modal, updates the provider, and removes a few fields that no visitor wanted to fill anyway.
The release passes functional QA because the form submits, the lead reaches the CRM, and the user experience feels cleaner than before.
The reporting damage appears later, usually in a marketing meeting where the numbers no longer behave. Total leads may still be visible, yet paid search starts drifting into Unknown, campaign-level reporting becomes weaker, and sales can call the leads while marketing struggles to explain which channel created them.
HubSpot documents how hidden form fields can pass values into contact properties without asking the visitor to fill them in, which is exactly why a seemingly harmless form redesign can damage reporting when hidden source fields are removed, renamed, or no longer populated at the right moment.
The same pattern appears in product and CRM releases. A product team improves onboarding and changes the event that previously represented activation. A CRM administrator cleans up stage names and accidentally changes the categories that a pipeline report depends on.
A billing team adds a new invoice status to reflect a real operational nuance, and a revenue model keeps treating the older statuses as the full universe. The business process improves locally, while the dashboard loses continuity because nobody mapped the reporting dependency before the change shipped.
Reporting incidents feel confusing because the user-facing system can appear healthy while the measurement relationship underneath has shifted. The website submits, the product flow works, and the CRM remains usable, while small operational updates quietly change the evidence that leaders use to understand performance.
A dashboard looks simple because its dependencies are hidden by design. A lead chart may appear as one smooth line, while the number behind it moves through a website form, tag manager, data layer, consent state, CRM mapping, lifecycle stage, warehouse table, transformation model, and dashboard filter before it reaches the screen.
A pipeline chart may look like a basic CRM view while depending on field-level permissions, owner mappings, picklist values, duplicate rules, currency logic, and historical stage mappings that changed several times over the life of the sales process.
Data engineers often describe this as lineage because the same field or event can travel through several systems before becoming a KPI. OpenLineage describes itself as an open framework for data lineage collection and analysis built around understanding how datasets, jobs, and runs relate to each other, and that idea matters even for ordinary business dashboards.
A useful dependency map shows the chart that uses a number and the upstream forms, fields, events, tables, transformations, and permissions that quietly shape the number before anyone sees it.
The hidden dependency problem becomes more serious as companies grow. A single CRM field may feed the sales dashboard, the finance reconciliation model, the marketing attribution report, the customer-health score, the compensation report, and the board KPI pack.
A product event may support activation reporting, lifecycle emails, renewal-risk scoring, usage-based billing, and AI recommendations. A website form may influence lead routing, campaign ROI, sales prioritization, and regional demand planning.
A mature analytics team therefore thinks in dependency maps rather than isolated reports. It wants to know which fields, forms, tags, events, IDs, statuses, schemas, and business rules feed each metric, because every release becomes safer when the team understands what could move downstream. Without that visibility, a dashboard may continue to load while the meaning of the number quietly changes beneath it.
Website releases often damage reporting before they damage anything visible to users. A redesigned landing page may look sharper, a new chatbot may capture more conversations, a fresh template may load faster, and a simplified form may increase submissions, while the tracking layer loses the source fields, events, consent behavior, or CRM mappings that explain where those users came from and what they did.
Tagging depends on details that website teams do not always experience as reporting infrastructure. Google Tag Manager explains that its data layer passes information to tags and can use events or variables to trigger measurement, which means changes to page structure, variable names, casing, form IDs, button text, or dataLayer pushes can alter reporting even when the user journey still feels normal. A form can submit, a CTA can work, and a thank-you page can render while the event that attribution depends on has stopped firing or started firing under a different name.
The most common failures look ordinary from the outside. A tag listens for a page path that no longer exists after a URL cleanup, a lead-source field stops filling because the new form provider handles hidden fields differently, a consent banner update changes when tags are allowed to fire, and a landing-page tool creates a subdomain that quietly changes the session path. The business sees a release that improves the website, while the analytics layer experiences a change in the evidence chain.
That is why website QA and analytics QA need to sit beside each other. Website QA checks whether a visitor can complete the journey. Analytics QA checks whether the journey still produces the right event, carries the right parameters, preserves campaign data, respects consent rules, maps into the CRM, and appears correctly after the next reporting refresh. When only the first layer is tested, the business can ship a better website and a weaker measurement system in the same release.
Product teams naturally change flows as the product improves. A SaaS company may redesign onboarding, a marketplace may simplify listing creation, a fintech app may shorten the payment setup flow, or a collaboration tool may move an important action into a new interface. These changes are made to improve the product, yet many product dashboards depend on the old sequence of events that originally defined activation, adoption, retention, or expansion risk.
Feature-management tools show how closely product behavior and analytics can be connected. LaunchDarkly explains that its SDKs send analytics events from feature flag evaluations and other SDK calls, which is a useful reminder that product releases can produce measurement signals as well as user experiences.
If targeting rules change, a feature is exposed to a new segment, or an experiment moves from partial rollout to full rollout, the analytics layer needs to know whether a metric changed because behavior improved or because the population and event logic changed.
Tracking-plan discipline exists for exactly this reason. Segment Protocols explains that a tracking plan can validate expected events against live events and generate violations when live events do not match the specification.
In plain business terms, the product can define which actions matter and then detect when a release starts sending something different. That matters because a renamed event can make activation appear to fall, a missing property can break segmentation, and a changed ID can disconnect product usage from accounts and revenue.
Product analytics breaks most painfully when the event was doing more work than anyone remembered. Activation events may feed growth reporting, customer-success alerts, lifecycle campaigns, revenue expansion models, and product-led sales signals.
A release that changes the event without mapping the old and new logic can make the product look worse, better, or simply different for reasons that have more to do with measurement than customer behavior.
A CRM starts as a place where sales teams manage their work and gradually becomes one of the most important reporting systems in the company. Leads, contacts, accounts, opportunities, owners, stages, close dates, deal amounts, lead sources, loss reasons, forecast categories, regions, and lifecycle statuses all become inputs to dashboards, models, compensation plans, revenue forecasts, attribution reports, and board packs.
CRM cleanup can create reporting damage because a sales-operations team may rename fields, merge picklists, redesign pipeline stages, update owner assignment, change required fields, add record types, or alter duplicate rules.
The sales process may become cleaner for users, while the analytics layer begins receiving values that older transformations, filters, or dashboard mappings no longer recognise. Salesforce’s guidance on changing a field API name is a useful reminder that fields carry technical identities as well as visible labels, and downstream systems often depend on those identities rather than the friendly names users see on screen.
Pipeline stages are a classic example. Sales may replace Negotiation with Commercial Review, add Procurement, and retire Contract Sent because the new process reflects how deals actually move. If the reporting model still maps the old values, late-stage pipeline can shrink, drift into Other, or disappear from stage-level reporting even though the sales team is doing exactly what it was asked to do. Leadership then reads the dashboard as a change in pipeline quality when the first movement came from a change in CRM language.
CRM changes should therefore be treated as analytics-impacting by default. A field, stage, picklist, record type, owner rule, permission setting, or lifecycle status that appears operational to the CRM team may be structural to reporting.
Changing it safely requires dependency review, transformation updates, historical-mapping decisions, and post-release validation before the new sales process reaches the next leadership review.
A schema is the shape of the data: field names, data types, tables, objects, event properties, IDs, relationships, and expected structures. Most business users never say the word schema, yet they feel schema changes when a report suddenly loses a column, fills a dashboard field with nulls, duplicates rows, or stops recognizing a category that used to power a KPI.
Modern data pipelines treat this risk seriously because source systems keep evolving. Airbyte’s documentation on schema change management explains that source schema changes are detected before syncing, while Stripe’s guidance on webhook versioning asks teams to evaluate breaking changes and run old and new webhook endpoints during an upgrade.
The common thread is operational caution: when the shape of source data changes, downstream consumers need time to adapt before the new structure becomes the only version available.
Reporting damage from schema changes tends to appear in a few familiar ways. Sometimes the pipeline fails loudly because an expected field no longer exists. Sometimes the job succeeds while sending blanks into downstream models because the mapping no longer works.
The most uncomfortable case is when the pipeline keeps loading data into a shape that the old transformation logic still accepts, while the business’s meaning has changed. The dashboard survives technically, yet the metric has drifted away from the process it was meant to represent.
The practical answer is a combination of detection and communication. Automated alerts can tell the analytics team that a field, table, or event property changed. A release note from the source-system owner can explain why the change was made, which process changed with it, and whether historical reporting needs to be mapped, restated, or clearly marked. Schema monitoring finds the movement; business context explains how to handle it.
Functional QA asks whether the experience works for the user. Tracking QA asks whether the business can still measure the experience after the release. The two checks often happen in the same user journey, but they answer different questions, which is why a product or website release can pass functional QA and still weaken reporting.
A user can submit a form while UTM values fail to pass. A customer can finish onboarding while the activation event never fires. A buyer can complete checkout while the purchase event fires twice. A sales rep can update an opportunity while the field used by the forecast model is now blank for integration users. The business action happened, but the business evidence arrived incomplete, duplicated, or unconnected.
Snowplow’s documentation on tracking plans describes them as agreements between producers and consumers of data, with owners and consumers made explicit. That language is useful because tracking QA is ultimately a contract check. If the product, website, or CRM sends an action into the analytics system, the receiving dashboards and models need the agreed event name, properties, identifiers, consent state, and timing to remain intact.
A practical tracking QA routine should follow the full path from user action to report. The team should confirm that the event fires once, required properties arrive, user or account IDs attach correctly, campaign parameters persist, CRM mappings land in the expected fields, consent behavior matches policy, and the dashboard receives the record after the next pipeline refresh.
That may sound like detailed work, because it is, yet it protects the larger business from acting on reports that no longer reflect the experience the company just shipped.
The deeper cause of many reporting failures is organizational. Product, CRM, finance, website, marketing, and operations teams often experience their changes as local improvements because they are focused on the workflow in front of them.
Analytics experiences those same changes as upstream movements in a reporting supply chain. A field, form, event, status, permission, or API response can be ordinary to one team and foundational to another.
Metadata systems are built around that reality. DataHub’s documentation describes Metadata Change Proposal and Metadata Change Log events as part of the metadata pipeline that records changes to data assets, which is a helpful model for business reporting as well.
The company needs a way for upstream changes to create visibility downstream, because the people changing the source system are often not the people who will be asked to explain the dashboard later.
A CRM administrator may change a field because sales entry has become messy. A product manager may rename an event because the old name no longer fits the feature. A website team may remove fields to improve conversion.
A finance operations team may add a billing status to reflect a real process. None of those teams are acting carelessly yet reporting breaks when the organization has no mechanism to ask which dashboards, metrics, models, alerts, and workflows depend on the thing being changed.
A lightweight analytics impact check changes the conversation. Before a release ships, the team asks which business numbers depend on the field, form, event, schema, permission, or status being changed.
If the answer touches lead attribution, activation, pipeline, churn, billing, revenue, usage, customer health, or forecasting, analytics needs enough notice to map the change, test the measurement path, update transformations, and explain the impact to users.
The table below keeps the practical logic visible. None of these changes has to be dangerous when analytics is included early, but each one can damage reporting when the release process treats the source system as separate from the dashboards that depend on it.
| System change | Reporting impact | Prevention |
| CRM field renamed or API identity changed | Dashboard formulas, transformations, integrations, or field mappings may fail or classify records incorrectly. | Run dependency checks, update the field map, test integrations, and validate key dashboards before users rely on the next refresh. |
| Website form changed | Lead tracking may lose UTM values, hidden fields, consent state, or CRM mappings even while submissions still reach sales. | Run tracking QA, confirm hidden-field behavior, submit test leads from multiple sources, and verify the CRM and dashboard path end to end. |
| Product event removed or renamed | Usage, activation, retention, onboarding, and customer-health reports may show artificial movement. | Review the event catalog, map old and new events, test required properties, and document any break in historical continuity. |
| CRM pipeline stage changed | Deals may move into Other, disappear from stage reporting, or create false changes in late-stage pipeline. | Update stage mapping, decide how history should be handled, and validate sales dashboards with sales operations before leadership review. |
| Schema updated | Pipelines may fail, fields may turn null, or transformations may keep running while the business meaning changes. | Use schema monitoring, communicate the business reason for the change, and update downstream models before the new structure becomes the standard. |
| Tag-manager trigger changed | Key events may stop firing, fire twice, or lose parameters needed for attribution and funnel reporting. | Test event firing, parameter capture, consent behavior, and event counts before and after release. |
| New lead source, billing status, or lifecycle category added | Reports may classify new values as Other, Unknown, excluded, or inconsistent across teams. | Update taxonomies, owner definitions, metric logic, and dashboard labels before the new category becomes common in reporting. |
| Source permission or API access changed | Pipelines may receive fewer fields or records while source users still see the data inside the application. | Validate service-account access, field-level permissions, and sample records after permission changes. |
Monitoring is essential because no release process catches everything. Source freshness can reveal that data arrived late, schema alerts can show that a source changed shape, event-volume monitoring can flag a product event that suddenly dropped, null-rate checks can catch fields that stopped populating, and duplicate checks can expose a tag or pipeline that started sending the same business action twice.
Monte Carlo’s pipeline observability documentation groups common checks around freshness, volume, and schema changes because many data failures first appear as changes in timing, size, or structure.
Those signals are valuable, especially after a source-system update, but they work best when they are paired with planned change discipline. A monitor can warn that a field went null after a CRM release; it cannot tell the data team in advance that the CRM release was going to rename the field.
The strongest reporting environments combine both habits. Planned change review gives analytics a chance to update mappings, transformations, dashboards, and user notes before a release. Monitoring catches unexpected breaks after the release, especially when a downstream effect was missed or a source behaves differently in production. Together, they prevent a technical reporting issue from becoming a political argument about which team broke the numbers.
The payoff is visible when users see a metric move and the company can answer calmly. Performance changed, measurement changed, or the data flow broke. Those are very different stories, and monitoring combined with change discipline helps the business separate them before decisions harden around the wrong one.
When a report breaks after a product, CRM, or website change, guessing wastes time. The faster method is to follow the dependency chain from the metric back to the source and identify the first place where expected evidence changed.
That chain usually runs through the visible dashboard, the model or transformation behind it, the pipeline that loads the data, the source object or event, and finally the product, website, CRM, or billing workflow that created the record.
Lineage tools exist because this kind of root-cause analysis becomes hard in distributed data systems. Atlan describes data lineage as a way to understand how data moves across the landscape and to support root cause analysis and impact analysis which is exactly what analytics teams need when a lead-source field disappears after a form update, or an activation event drops after a product release. The goal is to see both directions: what changed upstream, and which reports are exposed downstream.
If lead attribution weakens, the team should start with the form and source fields, then check whether UTM values still persist, hidden fields still populate, CRM mappings still land in the right properties, the pipeline received the record, channel taxonomy classified it correctly, and the dashboard refreshed after the load.
If activation drops after a product release, the team should check whether the old event still fires, whether the new event has been mapped, whether required properties still arrive, and whether the activation definition still reflects the product experience.
A good incident note should explain the break in ordinary business language. For example, the website form update removed hidden UTM fields, so total lead volume remained intact while channel attribution was incomplete between two dates; the mapping has been restored, and affected leads will be reprocessed where source data still exists. That kind of note restores confidence because it tells users what happened, which numbers were affected, and how to read the reporting period.
Reporting breaks after system changes because analytics is often treated as a downstream consumer. By the time the data team sees the change, the CRM field has already been renamed, the form has already shipped, the product event has already disappeared, the billing status has already entered production, or the API permission has already changed. The reporting team then has to explain a dashboard movement that could have been prevented with a short impact check before release.
A simple release rule catches most analytics-sensitive changes before they go live. Website releases that affect forms, tags, page paths, CTAs, consent behavior, or campaign parameters need tracking review. Product releases that change core actions need event-catalog review.
CRM releases that alter fields, stages, owner logic, picklists, permissions, or record types need dashboard dependency review. Billing and finance workflow changes need revenue-model review.
Snowplow’s Data Structures CI tool offers a useful software analogy because it can verify schema dependencies before code deployment which is the same mental model companies need for reporting: if the release depends on a measurement structure, confirm that the structure is ready before the release reaches production.
Analytics review should become one of the ordinary checks that helps the business ship safely, not an emergency function that arrives after users have lost trust in the dashboard.
A mature process adds only a few durable habits. The team identifies affected dashboards, updates transformations, tests tracking, checks freshness after release, validates the dashboard after the next refresh, publishes a change note where needed, and decides whether historical numbers require mapping or restatement. The work is smaller than the cost of explaining broken numbers in a leadership meeting after the decision has already been made.
Reporting breaks after product, CRM, or website changes because dashboards are connected to systems that never stop moving. Websites evolve, products improve, CRMs get cleaned up, billing workflows become more precise, marketing tests new forms, sales adjusts pipeline stages, finance adds categories, and operations changes statuses.
Each change may help the team making it, while the dashboard needs the analytics layer to understand what changed and how the evidence should now be read.
The answer is to treat measurement as part of operations. If a system creates the data that dashboards use, changing that system is also a reporting change. The analytics team needs enough visibility into releases to protect the measurement path while the business keeps improving the systems that run the work.
Reliable reporting is therefore less about preventing change and more about carrying meaning through change. A company can redesign its website, modernize its CRM, improve its product, and update its billing logic without losing trust in dashboards, provided the reporting dependencies are known, tested, and updated with the same care as the operational release itself.
Reporting breaks after a CRM change because dashboards often depend on CRM fields, stage values, owner mappings, source fields, record types, lifecycle statuses, and API identities that sales users may not think of as reporting infrastructure.
A field can look fine inside the CRM while the downstream pipeline receives a renamed value, a hidden field, a new picklist category, or a permission change that alters what the analytics system can read. The safest approach is to keep a list of reporting-critical CRM objects, review dependencies before changes go live, and validate the affected dashboards after the next refresh.
Website updates break analytics when forms, tags, button selectors, thank-you pages, hidden fields, URL structures, consent behavior, or data-layer variables change without measurement review.
The site may still work well for visitors because submissions, clicks, and page loads continue normally, while the tracking layer loses the events, campaign parameters, source fields, or CRM mappings needed for reporting. A good release process tests the full path from visitor action to event, CRM record, pipeline refresh, and dashboard output.
A schema change is a change to the structure of data that reporting depends on, such as a field name, column name, table, object relationship, event property, data type, or expected ID format.
Business users often feel schema changes only after a dashboard loses a field, fills with nulls, misclassifies records, or stops matching a source system. Schema monitoring is useful because it alerts the analytics team when a source has changed shape, but the source owner still needs to explain the business reason for the change so downstream logic can be updated correctly.
Product dashboards depend on event names, properties, IDs, and firing conditions that often change during feature releases. If activation used to be measured through one event and a new release moves that action into a different flow, the product may perform well while the dashboard shows a false decline.
Product teams can prevent this by maintaining an event catalog, mapping old and new events, testing required properties, and reviewing whether the metric definition still reflects the user behavior the business cares about.
A form change can remove hidden UTM fields, alter lead-source capture, change CRM property mapping, modify consent behavior, or move submission into a provider that handles events differently.
The business may still receive leads, which makes the break harder to notice, while marketing loses the ability to explain which campaign, channel, landing page, or region produced those leads. Testing should include real submissions from different sources, CRM field checks, event validation, and a dashboard review after the pipeline refreshes.
A sudden drop after a system change can reflect real business movement or measurement movement. An event may have stopped firing, a CRM value may have been remapped, a field may have turned null, a permission may have changed, or a pipeline may still be reading the old structure.
The quickest investigation follows the dependency chain from dashboard to model, pipeline, source object, and release note, so the team can identify whether performance changed, measurement changed, or data flow failed.
Tracking QA checks whether a user action still produces the right measurement evidence after a website or product change. It confirms that events fire on the right action, fire only once, carry required properties, attach user or account IDs, preserve campaign parameters, follow consent rules, map into the CRM, and appear correctly in downstream dashboards.
Functional QA proves the journey works for users; tracking QA proves the business can still understand the journey after launch.
A pre-change analytics checklist should ask which dashboards, metrics, transformations, alerts, pipelines, source fields, events, schemas, and business rules depend on the change. It should also identify whether historical mapping is needed, whether users need a change note, whether a backfill or restatement is required, and who will validate reporting after the release.
The checklist is especially important for CRM field changes, website forms, product events, billing statuses, tag-manager triggers, API permissions, and schema updates.
Companies prevent reporting breaks by treating analytics as part of the release process. Product, CRM, website, finance, and marketing teams should flag analytics-sensitive changes before they go live, while analytics reviews dependencies, updates mappings, tests tracking, validates dashboards, and documents any change in measurement logic.
Monitoring adds protection after release through freshness checks, schema alerts, event-volume monitoring, null checks, duplicate checks, and lineage views.
Ownership is shared because the analytics team does not control every source system that feeds a dashboard. The source-system owner owns the quality and communication of the field, event, form, status, permission, or API structure being changed. The analytics team owns pipelines, transformations, validation, and dashboard updates.
The business metric owner owns the meaning of the KPI and approves interpretation changes, especially when reporting logic affects forecasts, revenue, attribution, churn, customer health, or leadership KPIs.
Aug 04, 2026 / 27 min read
Aug 04, 2026 / 22 min read
Jul 31, 2026 / 24 min read