Why Reporting Breaks After Product, CRM, or Website Changes
Jun 26, 2026 / 27 min read
June 26, 2026 / 28 min read / by Team VE
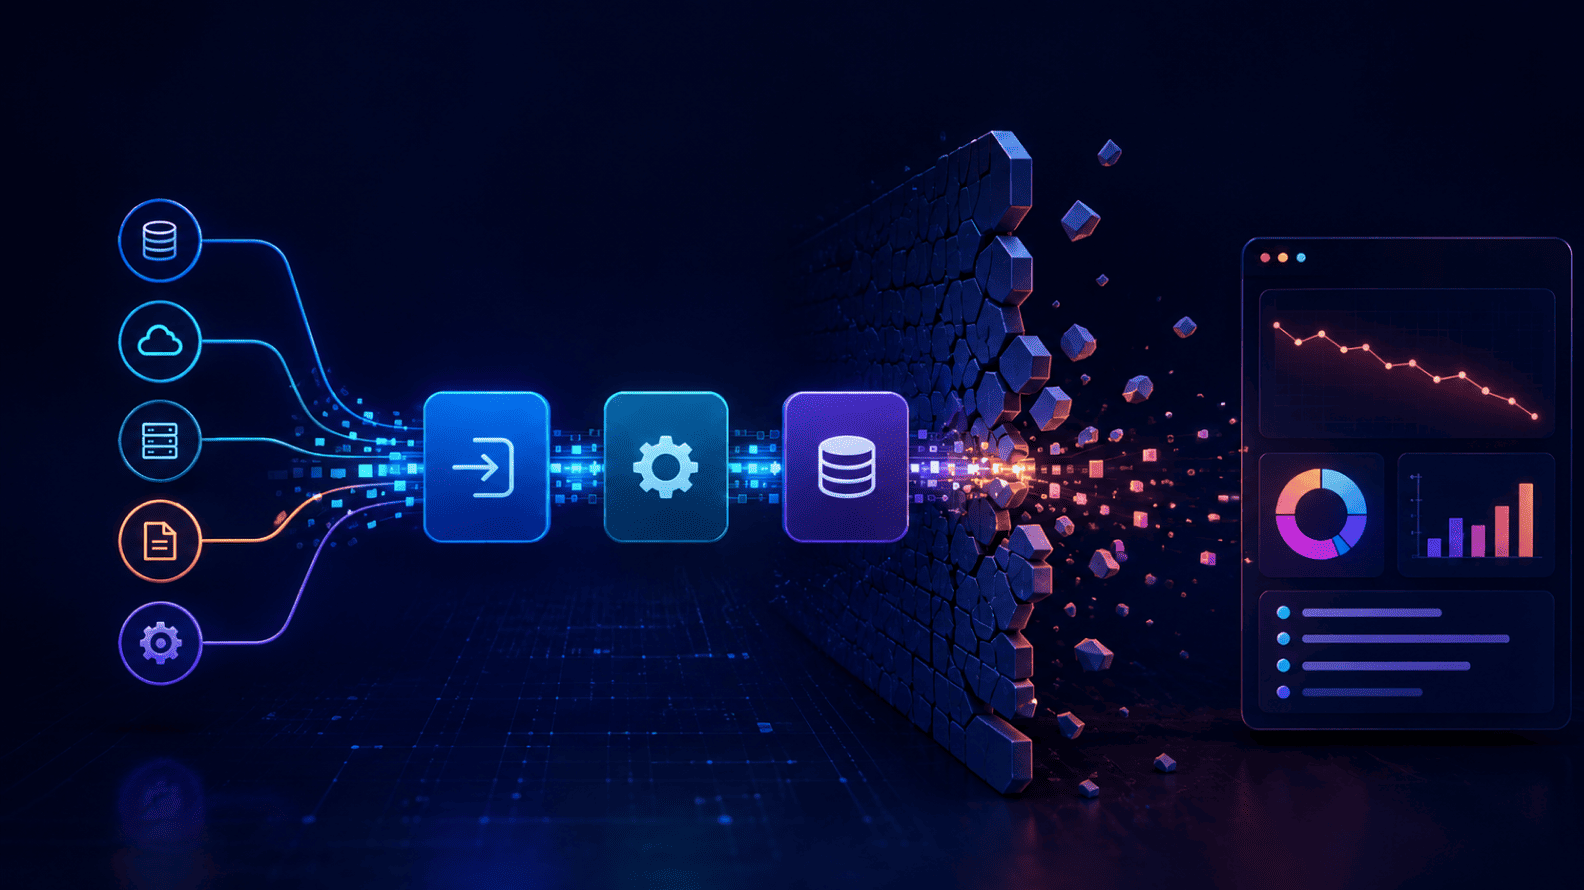
A data pipeline is the route business data takes from the place where work happens to the place where decisions are made. Reporting breaks when that route is delayed, blocked, duplicated, reshaped, or left unmonitored before the dashboard ever sees the data.
A data pipeline is the behind-the-scenes route that moves data from source systems such as CRMs, billing platforms, websites, product databases, finance tools, marketing platforms, and support desks into a place where it can be cleaned, modeled, analyzed, and shown in dashboards.
In business language, it is the reporting supply chain. A prospect fills out a form, a sales rep updates an opportunity, a customer pays an invoice, a user completes an action inside a product, and the pipeline carries those events toward the reports that leaders use to make decisions.
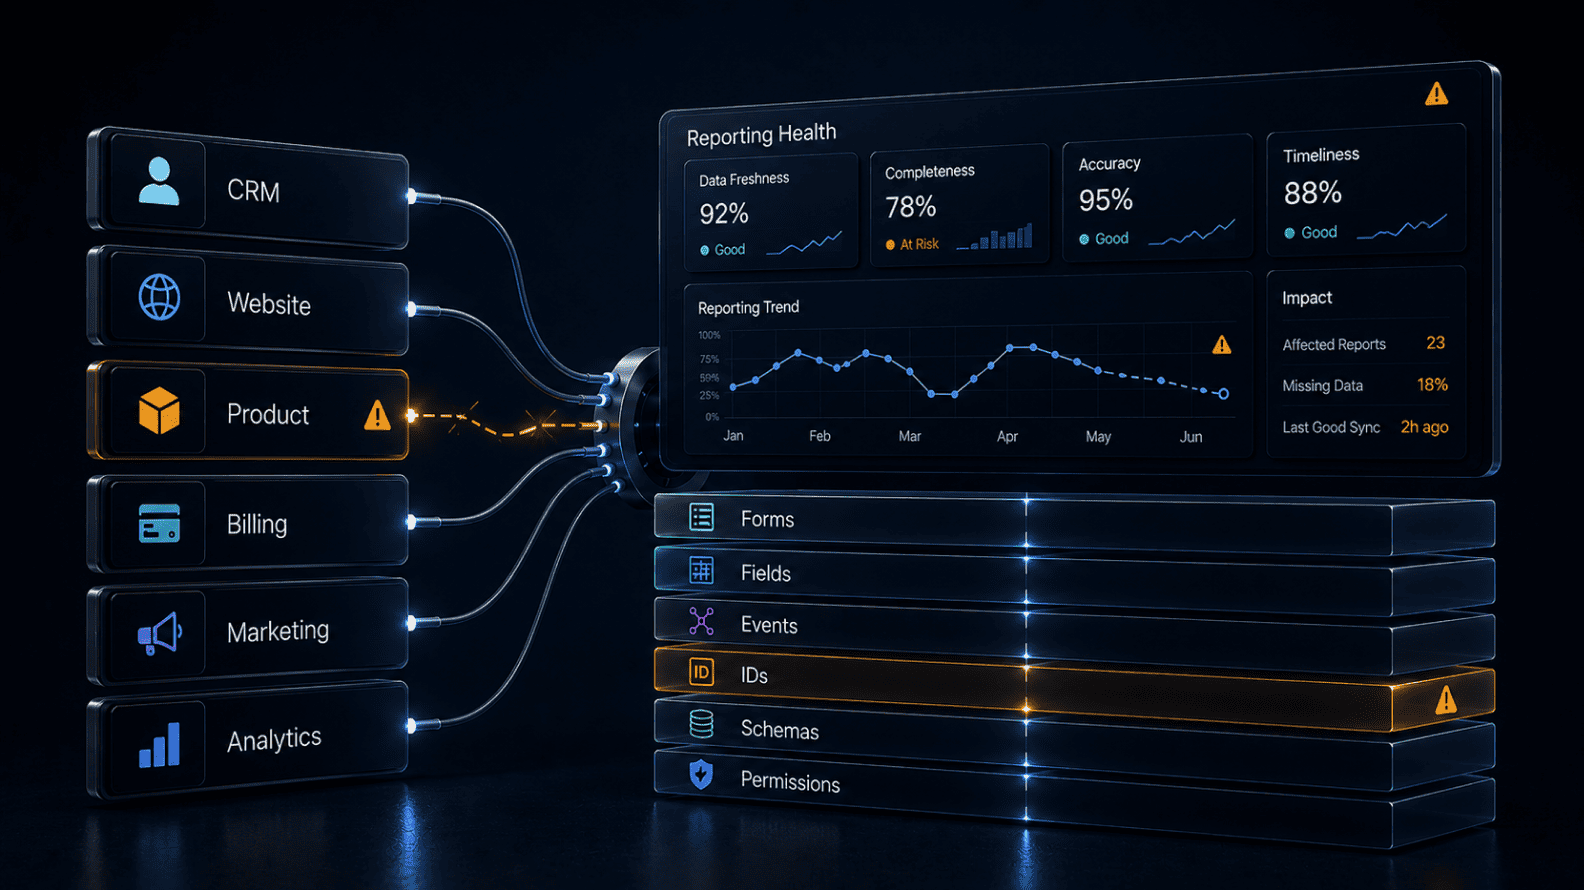
Reporting breaks when one part of that route changes without the rest of the system knowing. An API permission can change, a connector can miss a field, a transformation rule can keep using an old business definition, a load job can duplicate records, a schedule can run late, or a schema change can send downstream models into the wrong shape.
The dashboard may still open and look perfectly calm, which is what makes pipeline failures so damaging. People often discover the problem only when sales, finance, marketing, product, or support teams realise that the number on the screen no longer matches what happened in the business.
A data pipeline is a controlled process that moves data from one or more source systems to a destination where it can be stored, cleaned, transformed, modeled, analyzed, or used in reporting. The destination may be a warehouse, lakehouse, reporting database, semantic model, dashboard, or another business application. For business users, the practical meaning is simpler: every dashboard depends on whether the data route behind it ran correctly.
The first sign of a broken data pipeline is rarely dramatic. A revenue card still appears in the executive dashboard, the filters still respond, and the chart still looks polished enough to use in a meeting.
Then someone from finance mentions that invoices were raised yesterday and the number has not moved, or a sales leader says three major opportunities closed after the CRM update but the pipeline dashboard remains flat.
Nothing on the surface looks broken because the dashboard is only showing what reached it. The break happened earlier, somewhere along the route from the business system to the reporting layer.
The delay between the real business event and the reported business number is where pipeline risk lives. A website form can keep submitting leads while one hidden campaign field stops syncing. A support desk can keep serving agents while one ticket channel fails to load into the warehouse.
A billing platform can process payments while the nightly job rejects a set of records because a field changed shape. The operational tool continues doing its job for the team that owns it, while the analytics layer quietly loses part of the evidence it needs to describe the business.
This is why experienced analysts do not start by redesigning the chart when reporting looks wrong. They trace the route. Did the source send the data? Did the connector pull all the records? Did the schema change? Did the transformation still match the business rule?
Did the load complete once, and only once? Did the dashboard refresh after the latest table was ready? The answer usually sits in the chain behind the report, and the faster a team learns to follow that chain, the faster it can separate real business movement from a data route that has stopped behaving.
A business creates data while ordinary work happens. A prospect fills out a demo form, a rep changes an opportunity stage, a customer pays an invoice, a user completes a workflow inside the product, a support agent resolves a ticket, and finance issues a credit note.
Each action first lives inside an operational system built for a specific team, which is why the same company can have useful data scattered across Salesforce, HubSpot, Stripe, Zendesk, Shopify, product databases, ERP systems, spreadsheets, and marketing platforms.
The pipeline turns those scattered operational fragments into analytical memory. A revenue dashboard may need CRM bookings, billing transactions, refunds, tax treatment, currency logic, and finance adjustments. A lead-quality dashboard may need website submissions, UTM parameters, CRM lifecycle stages, duplicate rules, and sales acceptance logic.
A product-usage dashboard may need event data, account mapping, internal-user exclusions, release notes, and feature taxonomy. The dashboard looks like one report because the pipeline has done the work of moving, organizing, and connecting systems that were never designed to answer the same question on their own.
Fivetran explains ETL as extracting data from sources, transforming it into a usable format, and loading it into a central repository for analysis, while many modern teams now use ELT so raw data lands first and transformations happen later inside the warehouse.
The acronym matters less than the dependency it creates. Once a business relies on dashboards, it is really relying on a supply chain of extraction, transformation, loading, scheduling, monitoring, and recovery that must keep running even as the source systems keep changing.
Extraction is the first serious dependency in the pipeline because it asks another system to hand over the data reporting needs. A connector may pull deals from a CRM, orders from an ecommerce platform, invoices from a billing tool, events from a product database, tickets from a helpdesk, or campaign performance from ad platforms.
To the business user, the source system still appears healthy. To the pipeline, access depends on credentials, permissions, APIs, selected streams, rate limits, field visibility, and the source continuing to send data in the expected shape.
Small changes at this stage can change the story the dashboard tells. If a CRM admin removes field-level access from the integration user, pipeline value can fall even while sales reps still see the field inside the CRM. If a website form stops sending campaign parameters, total leads can remain visible while attribution weakens.
If an API token expires, the dashboard can keep showing yesterday’s data with no obvious warning unless freshness is visible. If a source platform changes a limit or a stream is deselected, the report may receive only part of the business.
Fivetran describes connectors as the components that extract data from sources and load it into destinations, which is a useful business reminder because the dashboard can only report what the connector successfully received.
Extraction checks therefore need to look beyond whether a sync technically ran. Teams also need to know whether the expected records, fields, streams, and permissions were present, and whether the data leaving the source still reflects the business event the dashboard claims to measure.
Transformation is the part of the pipeline where data stops being a raw export and starts becoming a business number. Country names are standardized, refunds are subtracted, customer records are matched across systems, campaign names are mapped into channels, product events are grouped into features, and sales stages are translated into forecast categories.
A raw invoice becomes net revenue, a raw form fill becomes a qualified lead, and a raw event becomes active usage only because the transformation layer contains rules that give those records business meaning.
This is where many pipeline failures become deceptively clean. The job runs, the table updates, and the dashboard refreshes, yet the business number is wrong because the rule no longer fits the company. A sales team adds a new stage called Contract Signed, while the model still counts only Closed Won.
Finance introduces credit notes, while the revenue model still treats gross billing as the planning number. Marketing changes campaign taxonomy, while the channel map keeps sending new campaigns into Unknown. Product replaces project_created with workspace_created, while activation logic still depends on the old event. The pipeline has not crashed. It has simply preserved yesterday’s business logic after the business moved on.
AWS explains ETL transformation as the stage where business rules clean and organize raw data for analytics, and the phrase business rules is the heart of the matter. Transformation code is not just engineering plumbing when it defines revenue, pipeline, churn, customer health, or active usage. It is company policy written into the data route, and it needs the same care as any other business rule that influences decisions.
Loading sounds mechanical, which is why business teams often overlook it. Data has been extracted, transformations have run, and the destination now needs to receive the records inside a warehouse table, reporting database, BI model, or downstream application.
A clean failure at this stage is inconvenient but understandable: the job fails, the table does not update, and the dashboard is stale. The harder cases are partial loads and duplicate loads, where the report continues to look alive while the data beneath it is incomplete or inflated.
A partial load can make one region disappear from a sales dashboard, one payment status vanish from revenue reporting, or one ticket channel look quieter than it really was. A duplicate load can create the opposite problem, making orders, leads, invoices, support cases, or product events appear to rise. Because the dashboard still refreshes, users may read the movement as business performance rather than delivery failure inside the pipeline.
Airbyte’s documentation on rejected records is a useful reminder that a sync appearing to run does not guarantee every useful row made it into the destination. Reliable loading checks therefore ask how many rows were expected, how many arrived, whether any records were rejected, whether the load appended or merged correctly, whether primary keys behaved as expected, and whether the dashboard refreshed only after the destination had received the final version of the data.
Pipelines rarely move every source at the same speed. A CRM may sync every hour, a finance table may update after midnight, a billing connector may run every six hours, product events may stream continuously, and an ad platform may revise conversion data after the first report has already been viewed. A single dashboard can therefore combine several different moments in time while presenting itself as one coherent picture of the business.
That difference matters most when the dashboard is used inside an operating rhythm. A leadership report reviewed at 10 a.m. may include current CRM data and yesterday’s billing data. A campaign dashboard may show current spend and delayed qualified leads.
A support dashboard may show current tickets and stale staffing information. People read the view as if all sources agree on the same moment, while the pipeline has stitched together data with different levels of freshness.
Apache Airflow’s documentation on timetables and scheduling shows how much thought goes into when workflows run, and business dashboards need that scheduling reality to become visible to users.
Freshness labels should communicate when critical sources last updated, whether upstream jobs completed before downstream refreshes, and whether the reporting period is final or still settling. A dashboard that refreshed five minutes ago can still be old if the source feeding it has not moved since yesterday.
A schema is simply the shape of the data: tables, fields, names, data types, relationships, event properties, and expected categories. Business users rarely use the word, but they feel schema changes when a dashboard starts behaving strangely after a CRM cleanup, website release, billing update, or product event change.
A field is renamed, a table is split, an ID moves from number to text, a new invoice status appears, a product event property changes name, and the pipeline downstream is still expecting the old shape.
Schema changes can fail loudly, with a query breaking because a column no longer exists. They can also fail quietly, which is more dangerous for reporting. The pipeline may continue running while a field fills with null values, a new category falls into Other, or a model keeps using an old mapping that no longer covers current business activity. Users see a clean dashboard, but the categories, totals, or segments no longer mean what they used to mean.
Confluent’s Schema Registry documentation frames schema management around controlling how data structures evolve over time, and that discipline matters well beyond streaming systems. Reporting teams need to know when a source shape changes before the dashboard turns that change into a business story.
Schema alerts, field maps, event catalogs, and release notes all serve the same purpose: they help teams distinguish real movement in the business from movement caused by a changed data shape.
A pipeline without monitoring asks the business to trust that yesterday’s route is still working today. Basic monitoring tells the data team whether a job ran. Serious monitoring tells them whether the data is fresh, complete, structurally stable, and behaving within the range the business expects.
It watches row volume, latency, schema changes, rejected records, duplicate spikes, null spikes, and downstream impact, so broken data is noticed before someone uses it to make a decision.
Lineage adds another layer of control because it shows which reports, tables, jobs, and dashboards depend on an affected dataset. When a source field fails, a team with lineage can see whether the issue touches a leadership scorecard, a finance table, a churn model, or only an exploratory report. Without that map, every pipeline incident becomes guesswork, and the business learns about impact through meetings, complaints, or contradictory reports.
OpenLineage describes itself as an open platform for collecting and analyzing lineage metadata across datasets, jobs, and runs, while Datadog’s Data Streams Monitoring documentation focuses on visualizing pipeline architecture and monitoring end-to-end latency across streaming pathways. The tools differ, but the management idea is the same. Data teams need visibility into the route, not just the destination, because the dashboard is rarely the first place a problem begins.
The word broken hides several different failure modes. Some failures are loud, such as a dashboard chart that cannot load because a column disappeared. Others are quiet, such as a stale table, a partial extract, a duplicate load, or a mapping rule that sends a new category into the wrong bucket. Business risk depends on the type of failure, because users react very differently to a missing chart than to a normal-looking chart with the wrong number.
| Failure type | What users usually see | What may be happening underneath |
| Stale reporting | A dashboard shows old numbers or no meaningful movement. | A scheduled job failed, a source was unavailable, or the dashboard refreshed before upstream jobs completed. |
| Incomplete reporting | One team, source, region, product, channel, or period appears unusually low or disappears. | A partial extraction, rejected records, changed permissions, or source schema update stopped some data from arriving. |
| Duplicated reporting | Revenue, leads, orders, tickets, or events look unusually strong. | A load job reran without safe merge logic, source records duplicated, or primary keys failed. |
| Misclassified reporting | Total numbers look plausible, but segment, channel, stage, product, or region views feel wrong. | Mapping rules are outdated, naming conventions changed, or new categories are not covered by the transformation. |
| Broken dashboard | Charts fail, filters disappear, or fields cannot be found. | A column, table, model, or semantic field changed in a way the BI layer cannot resolve. |
| Silent quality failure | The report loads, yet experienced users feel the number does not match reality. | Null spikes, invalid values, missing IDs, late records, duplicate rows, or logic drift are changing the metric quietly. |
Loud failures often receive faster attention because they stop the user from moving forward. Quiet failures deserve more discipline because they let the meeting continue with a number that looks usable.
Many companies still treat data quality as a cleanup job that begins after somebody says the dashboard looks wrong. Mature teams move those checks earlier, directly into the pipeline, so weak data is stopped, flagged, or explained before it becomes a leadership number.
If a lead table normally receives two thousand records a day and suddenly receives two hundred, the pipeline should raise the question before marketing builds a story around weak demand. If invoice IDs duplicate, the issue should be caught before finance opens the revenue report.
Pipeline quality checks are most useful when they reflect the business promise of the data. Revenue pipelines need uniqueness, valid currency, refund treatment, and reconciliation checks. Lead pipelines need source completeness, duplicate checks, accepted values, and freshness.
Product pipelines need event catalogs, required properties, user and account IDs, and release-aware volume checks. Support pipelines need channel coverage, status values, SLA fields, and latency monitoring. The check is valuable because it protects the decision the data supports.
Dagster’s asset checks documentation explains that checks can verify properties such as null values, schemas, and refresh needs on data assets, which places validation inside the same operational flow that produces the data.
Soda’s documentation frames data quality as a shared workflow for monitoring and fixing data problems. Both approaches point to a healthier reporting culture, where bad data is treated as a pipeline condition to manage, not as a dashboard embarrassment to explain later.
Many pipeline failures begin as reasonable business changes. Sales operations updates opportunity stages to reflect how deals now move. Marketing changes form logic to improve conversion. Product renames events because the feature has evolved.
Finance adds a billing status to describe a real process more accurately. Each team is improving the system it owns, while analytics sits downstream from all of those decisions.
This is how reporting damage enters quietly. The source owner sees a local improvement. The pipeline sees a changed dependency. A field, event, status, permission, table, or API shape that once fed a dashboard no longer behaves the same way, and the data team only discovers the change when the report starts drifting. The fix is rarely to slow the business down. The fix is to make analytics impact part of ordinary system-change communication.
Soda Core’s data contract approach is useful because it makes expectations explicit in a form that can be validated. In business terms, data producers and data consumers need a similar contract around reporting-critical fields, events, IDs, categories, and source structures.
Before a source change goes live, someone should know which dashboards depend on it, whether historical mapping is needed, whether users need a note, and who will validate the report after the next refresh.
Pipelines will fail because source systems, networks, APIs, permissions, schemas, schedules, and business processes keep changing. The more important question is whether a failure is contained or allowed to travel into reporting.
A reliable pipeline does more than retry jobs. It logs what happened, prevents duplicate loads, quarantines bad records, alerts the right owner, marks affected dashboards when data is stale, and leaves enough evidence for the team to understand business impact.
Weak error handling creates the worst kind of reporting incident because the failure remains invisible until users notice the result. A job fails partially, retries badly, duplicates records, and the dashboard interprets the extra rows as growth.
A source rejects records, the pipeline completes, and the support report silently excludes a channel. A CRM permission changes, the extraction step returns fewer fields, and the sales dashboard still refreshes with incomplete pipeline detail.
Prefect’s documentation on retries shows how workflow systems can retry failed tasks with configured limits and delays, but retrying is only one part of the operating discipline. Teams also need to know whether the retry created duplicates, which records were missing, which dashboards were affected, who owns the source issue, and whether users should pause decisions until the data is repaired. Error handling is where a technical failure either stays manageable or becomes a business confidence problem.
A data specialist monitors pipelines because every important dashboard depends on a route that business users cannot see. The exact controls depend on risk. Revenue and finance pipelines need stricter reconciliation, uniqueness, adjustment, and audit checks.
Lead pipelines need source completeness, campaign mapping, deduplication, and freshness. Product pipelines need event volume, schema stability, ID quality, and release context. Support pipelines need complete channel coverage and short latency because stale queues can affect staffing decisions.
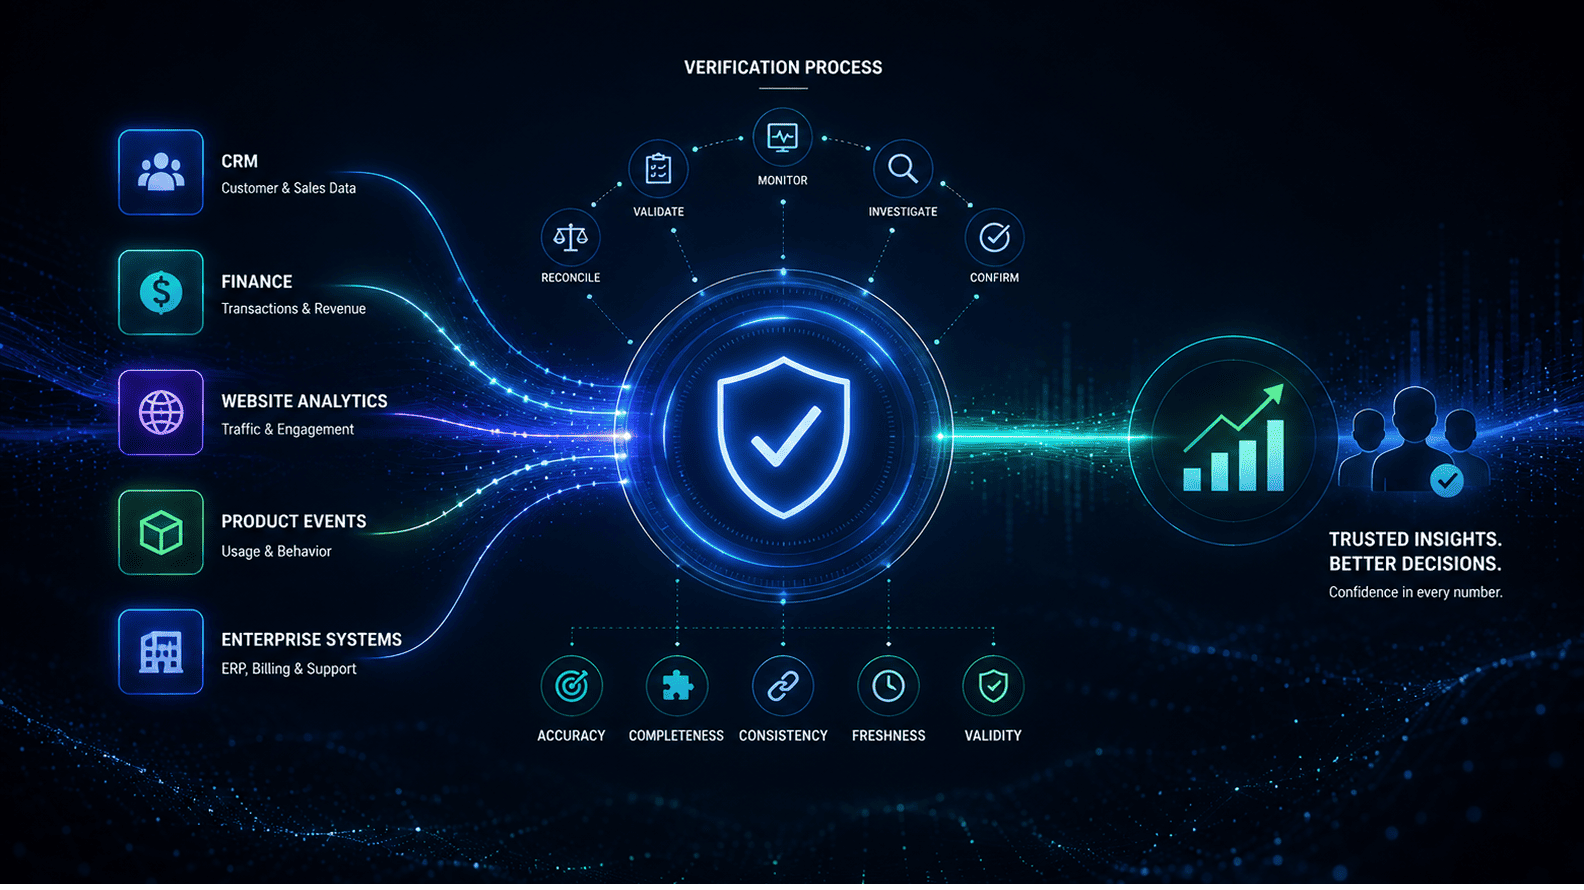
Good monitoring combines technical health with business plausibility. A successful job status is useful, but it does not answer whether row volume looked normal, whether a required field suddenly went blank, whether a source category changed, whether a downstream dashboard is stale, or whether the number still makes sense given what happened in the business.
If revenue doubles overnight, leads fall to zero, active users spike after a release, or ticket volume drops sharply on a normal workday, the team asks whether the business changed or the route changed.
Datadog’s documentation for Data Streams Monitoring emphasizes architecture visibility, end-to-end pipeline health, latency, and slowdowns in event-driven systems. Business reporting needs the same mindset applied to analytical pipelines.
Monitoring should help the company know when data is late, incomplete, duplicated, structurally changed, or strange enough to deserve investigation before a dashboard becomes the basis for action.
A company does not need a giant data platform to manage pipeline risk more intelligently. It needs a clear understanding of the reporting routes that matter most and enough discipline to keep those routes visible.
For each critical pipeline, teams should know which business decision depends on it, which source systems feed it, who owns each source, which tables, fields, streams, IDs, events, or statuses are critical, how often the pipeline runs, and how much latency the decision can tolerate.
The same checklist should include transformation rules, expected row volumes, validation checks, rejected-record handling, schema-change detection, freshness labels, alert owners, incident history, known limitations, and the last review date.
This sounds basic because it is basic in the best sense of the word. Many reporting problems become expensive because the company knows the dashboard exists but cannot quickly explain the route feeding it.
OpenLineage’s documentation describes lineage as metadata about datasets, jobs, and runs, which is exactly the kind of memory a team needs when a report fails after months of quiet complexity. The checklist does not replace engineering tools, but it gives business and analytics teams a shared way to understand which routes carry the most decision risk and which ones need tighter controls.
| Pipeline step | What happens | What can break reporting |
| Extract | Data is pulled from systems such as CRM, billing, product databases, marketing platforms, finance tools, websites, or support desks. | Credentials expire, permissions change, fields disappear, APIs throttle, streams are deselected, or partial syncs pull only part of the source. |
| Transform | Raw data is cleaned, joined, mapped, deduplicated, standardized, and shaped into business metrics. | Old business rules remain in code, joins multiply records, new categories are misclassified, or formulas differ from approved definitions. |
| Load | Data is written into a warehouse, lakehouse, reporting table, BI model, or downstream system. | Records are rejected, jobs load partially, retry logic duplicates rows, or destination structures no longer match expected writes. |
| Schedule | Jobs run in the right order and at the right time for the reporting use case. | Downstream dashboards refresh too early, sources update at different frequencies, time zones cause gaps, or retries happen after the meeting. |
| Monitor | Freshness, volume, schema, latency, rejected records, duplicates, and anomalies are checked. | Alerts are missing, noisy, routed to the wrong owner, or disconnected from downstream dashboard impact. |
| Handle errors | Failures are logged, retried safely, quarantined, escalated, communicated, or rolled back. | Silent failures travel into reporting, repeated retries duplicate data, incident notes are missing, or users are not warned before they act. |
A data pipeline is the route by which business activity becomes business evidence. When the route is healthy, dashboards feel current, numbers reconcile, and leaders spend more time discussing decisions than questioning whether the report can be trusted. When the route weakens, reports become stale, incomplete, duplicated, misclassified, or quietly shaped by logic that no longer matches how the company works.
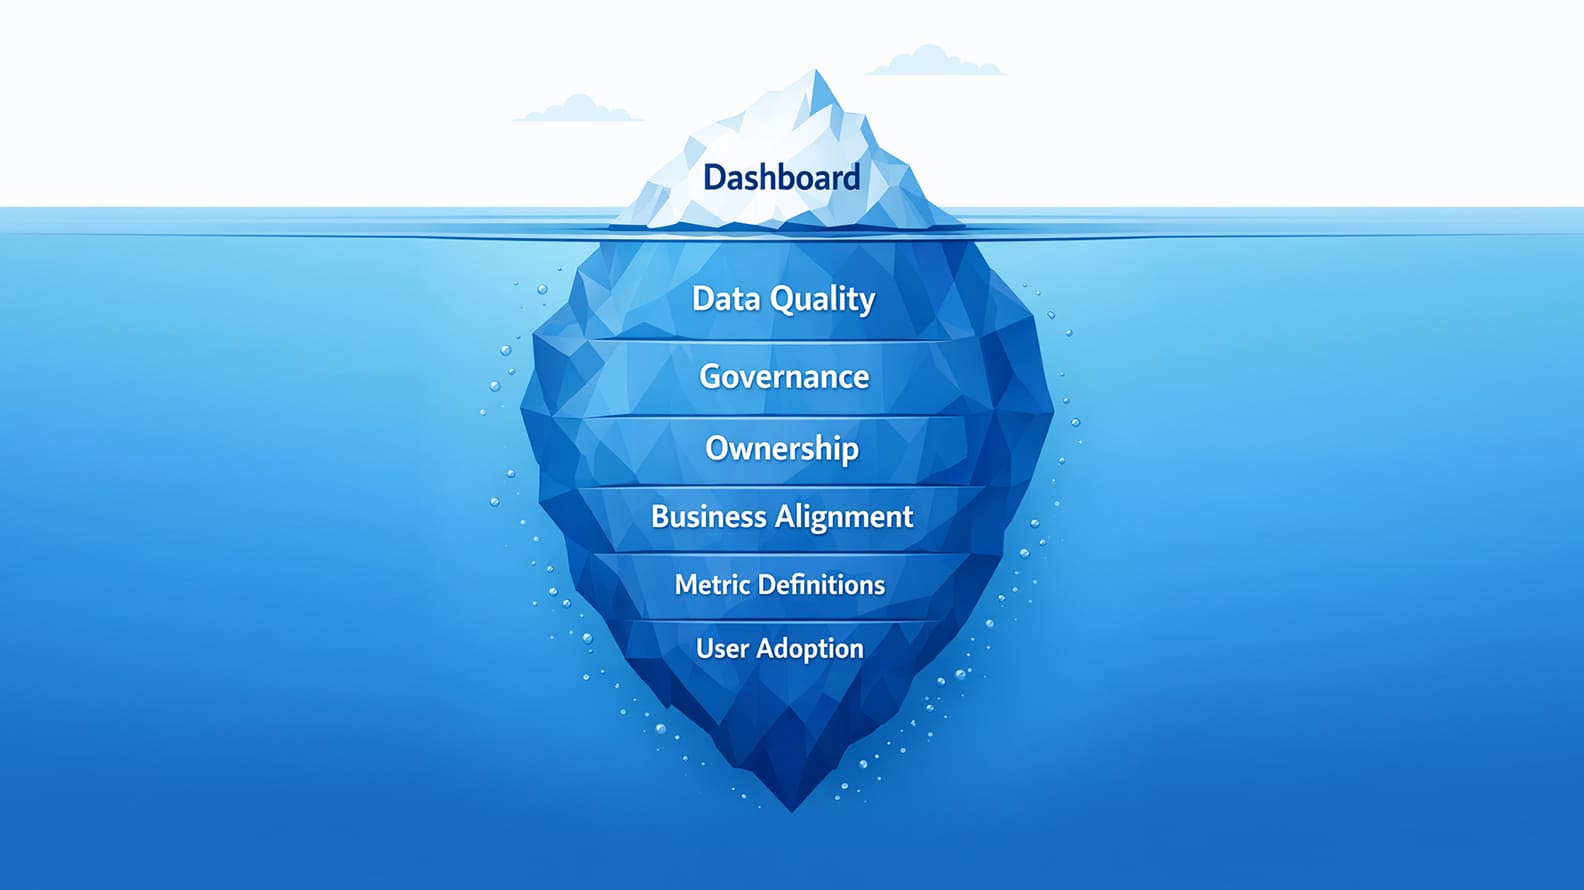
The pipeline is not the whole analytics system. The business still needs metric definitions, ownership, governance, interpretation, and adoption. Yet without a reliable pipeline, even the best dashboard becomes a fragile surface because the number on the screen has lost contact with the path that should have brought it there. The dashboard is where people read the business. The pipeline is how the business arrives.
A data pipeline is the route data takes from the system where work happens to the place where that data can be used for reporting, dashboards, analysis, automation, or decision-making. A pipeline might move leads from a CRM, invoices from a billing platform, events from a product database, tickets from a helpdesk, and campaign data from ad platforms into a warehouse or BI model.
The easiest way to understand it is as a reporting supply chain. The dashboard is the final shelf where the number appears, while the pipeline is the system that extracts, cleans, moves, checks, and delivers the data. When that route weakens, the dashboard may still show something, but the number can become stale, incomplete, duplicated, or shaped by outdated logic.
Data pipelines break reporting because dashboards depend on upstream systems that users usually cannot see. A CRM permission can change, an API token can expire, a product event can be renamed, a source field can disappear, a transformation rule can become outdated, or a load job can partially fail. Any of those changes can alter what reaches the dashboard.
The difficult part is that the dashboard often keeps loading. Users see a normal-looking report and assume the route behind it is healthy. Pipeline monitoring exists because a working interface does not prove that the right data arrived at the right time in the right shape.
The main stages are extraction, transformation, loading, scheduling, monitoring, and error handling. Extraction pulls records from source systems. Transformation turns raw records into business-ready structures. Loading writes the data into a destination. Scheduling controls when jobs run. Monitoring checks whether the pipeline is healthy. Error handling determines what happens when something goes wrong.
Different companies implement these stages in different architectures, such as ETL or ELT, but the reporting dependency remains the same. If one stage fails quietly, the dashboard can show a number that feels precise while no longer representing the full business event.
ETL means data is extracted, transformed, and then loaded into the destination. ELT loads raw data first and transforms it later inside a warehouse or lakehouse. Modern cloud warehouses made ELT more common because they can handle heavier transformation work after the data lands.
For business users, the important issue is where the business logic lives. If revenue, customer, lead, churn, or usage logic is applied before loading, controls need to exist there. If the logic is applied after loading, the warehouse or semantic layer needs those controls. Either way, the metric depends on tested, owned, and documented rules.
A schema change is a change to the shape of source data, such as a field name, data type, table, event property, ID structure, or status value. A source system may treat the change as small, while the pipeline downstream still expects the old structure.
Dashboards break when those expectations no longer match. A renamed field can create null values, a new category can fall into Other, a changed ID type can damage joins, and a removed event can make a product metric appear to drop. Schema monitoring gives data teams a chance to handle the change before users interpret it as business movement.
A dashboard shows old data when the pipeline feeding it has not refreshed, a source system was unavailable, a scheduled job failed, or the dashboard refreshed before upstream jobs completed. It can also happen when one source is current and another source is stale, creating a mixed picture inside one report.
Good dashboards make source freshness visible. Users should know when the critical sources last updated, whether the reporting period is final, and whether the dashboard is combining sources with different update cycles.
Pipeline monitoring is the practice of checking whether data jobs are running properly and whether the delivered data looks trustworthy. It covers job status, freshness, row volume, schema changes, rejected records, duplicate spikes, null spikes, latency, and downstream dashboard impact.
The purpose is to catch issues before business users find them in a meeting. A strong monitoring setup routes the right alert to the right owner, so source problems, transformation failures, and dashboard freshness issues can be handled before the number becomes part of a decision.
Duplicate data can come from unsafe retries, missing primary keys, bad merge logic, duplicated source records, event firing more than once, or the same real-world entity appearing in more than one system. Duplicate loads can inflate leads, invoices, orders, support tickets, product events, or customer counts.
The fix begins with clear entity logic. Teams need to know whether invoice ID, order ID, opportunity ID, user ID, account ID, email address, subscription ID, or ticket ID should be unique for the decision being made. Pipelines also need safe retry behavior so a failed job does not create double-counted performance.
Responsibility depends on where the break happened. Data engineers usually own connector reliability, orchestration, loading, monitoring, and infrastructure. Analytics engineers or analysts often own transformation logic and reporting models. Source-system owners own fields, permissions, forms, events, statuses, and process changes that create the data in the first place.
A real incident often needs more than one owner. If a CRM field change breaks pipeline reporting, the CRM owner, data team, and dashboard steward may all need to be involved. Pipeline reliability is technical, but source stability is also a business responsibility.
Data specialists should monitor freshness, job success, row volume, rejected records, schema changes, duplicate spikes, null spikes, source availability, transformation results, latency, lineage, and downstream dashboard impact. They should also maintain incident notes for failures that affect leadership or operational reporting.
The monitoring standard should match the business risk. Revenue, finance, pipeline, churn, support backlog, and lead-flow pipelines deserve stronger controls than low-stakes exploratory datasets. The goal is to detect pipeline failure before someone makes a decision from stale, incomplete, duplicated, or misclassified data.
Jun 26, 2026 / 27 min read
Jun 26, 2026 / 34 min read
Jun 26, 2026 / 35 min read