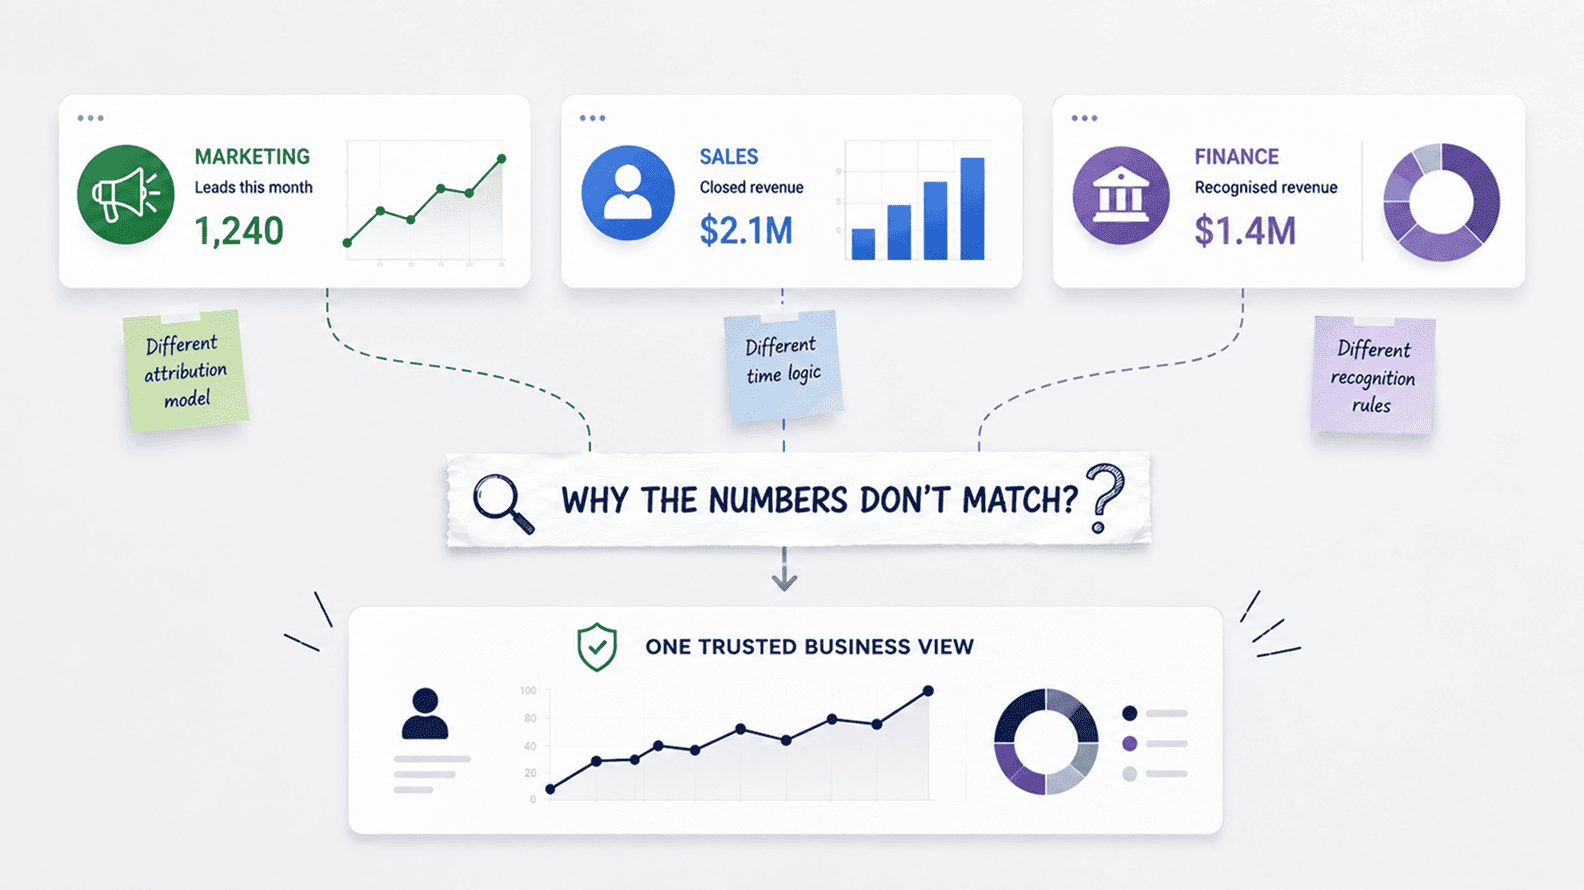
Why Marketing, Sales, And Finance Reports Do Not Match
Aug 04, 2026 / 27 min read
July 10, 2026 / 15 min read / by Team VE
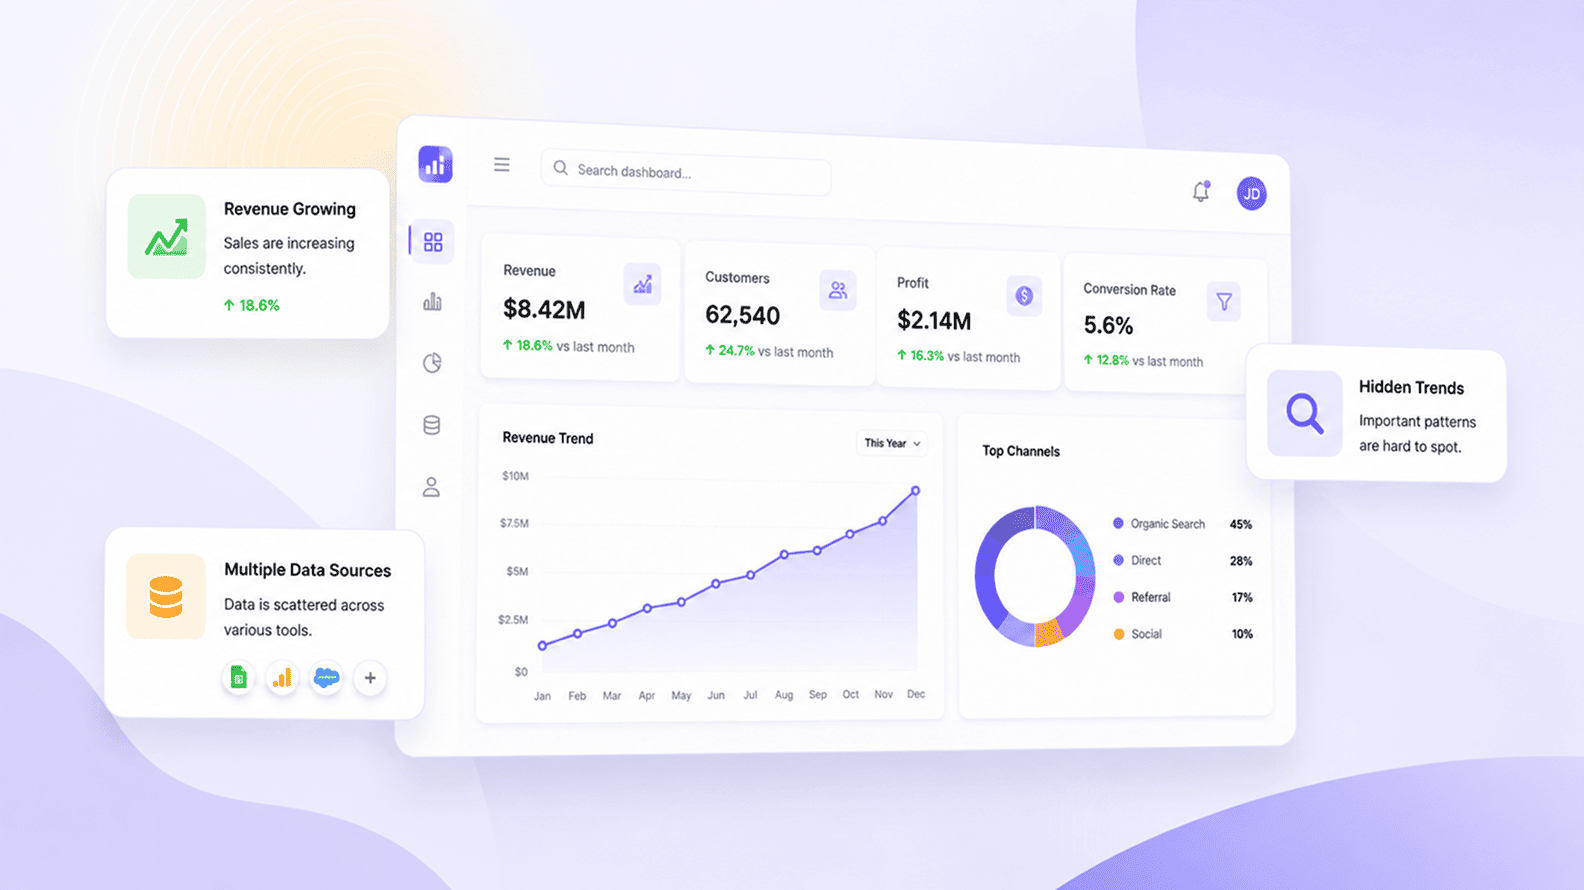
When Should a Business Hire a Data Analyst?
A business does not need a data analyst the moment it starts collecting data. It needs one when its numbers have begun shaping decisions, while the people using those numbers still cannot explain what is really happening.
A business should hire a data analyst when decision friction starts repeating itself: revenue moves and nobody can explain the driver, leads rise while qualified pipeline stays flat, sales and finance bring different versions of the same number to a review, churn appears concentrated in one customer group, or dashboards keep multiplying while leaders still ask for manual spreadsheet checks before acting. The signal is not raw data volume. The signal is that the company has more measurement than understanding.
A strong analyst sits between systems and judgment. They turn CRM records, billing data, campaign results, product events, finance adjustments, support tickets, and trusted spreadsheets into a clearer view of performance. The business usually feels the need first as confusion, then as rework, then as doubt in meetings.
By the time teams are maintaining private versions of official reports, the company is already paying for analysis. It just has not hired the person whose job is to do that work properly.
A data analyst is a business-facing data professional who investigates performance, validates metrics, explains patterns, and helps teams make better decisions using data. The role often involves SQL, spreadsheets, dashboards, segmentation, source reconciliation, metric definitions, trend analysis, and stakeholder communication, although its deeper purpose is interpretation: helping the business understand why a number moved, whether the movement deserves trust, and what decision should follow.
Most businesses do not identify the need for a data analyst cleanly. They feel it as friction. A meeting opens with a dashboard, and within minutes the discussion has moved away from performance into the reliability of the numbers. Revenue is up, but finance is cautious because collections and recognised revenue tell a slower story.
Marketing says demand is improving because form fills have risen, while sales says the new leads are not becoming serious opportunities. Operations says utilisation looks healthy, while team leads complain about overload. Nobody is necessarily wrong. Each team is looking at the company through the system closest to its daily work.
That is often the first real hiring signal. The company has enough data to create disagreement, and the work is no longer about pulling another report. It is about understanding which evidence deserves trust, why the numbers differ, and how the business should respond.
Early-stage companies can manage basic reporting through founders, operators, finance people, and marketers, but the need changes when the questions become layered: why did revenue grow while margin fell, why are leads increasing while qualified opportunities stay flat, or why did product usage move after a release? Those questions require investigation, context, and judgment.
Growing companies often mistake dashboard coverage for analytical maturity. There is a sales dashboard, a marketing dashboard, a finance dashboard, a product dashboard, and a leadership scorecard, so the business looks more data-driven than it was a year earlier. Yet meetings remain foggy because the reports describe movement without explaining whether the movement is healthy, durable, caused by real customer behaviour, or caused by the way the data was captured.
Stripe gives a useful example of the difference between data access and interpretation. Its Sigma product lets businesses query Stripe payment data with SQL and create custom reports, which is powerful for teams that understand the questions they want to answer.
Even then, someone still has to decide whether the company is studying failed charges, customer cohorts, refund patterns, pricing changes, or revenue drivers. The tool expands access, while the analyst gives the work shape.
One of the strongest signs that a business needs a data analyst is repeated disagreement over familiar words. Revenue, customer, lead, churn, conversion, utilisation, margin, and active user sound simple until different teams put them in the same meeting.
Sales may think about revenue through closed-won deals, finance through invoices or recognition rules, and leadership through cash movement or forecast confidence. Marketing may celebrate rising form fills while sales only cares about leads that become qualified opportunities.
GitLab offers a useful window into this kind of work because its public Data Analytics handbook describes analytics as supporting reporting, analysis, dimensional modeling, and a central enterprise data warehouse for all teams. The point is not that every growing company needs GitLab-level data infrastructure.
The point is that shared measurement eventually needs ownership. A good analyst can trace where each number comes from, compare definitions, document date logic, show how filters differ, and make the assumptions visible enough for leadership to choose one definition for each decision.
Spreadsheets are often where the first serious analytical thinking happens, and there is nothing wrong with that. The warning sign appears when spreadsheets become more trusted than the official reporting system. A sales operations manager exports CRM data every Friday and corrects stages before the pipeline meeting.
A finance manager keeps a revenue bridge outside the BI tool because refunds and credits are not handled cleanly. A marketing manager maintains a campaign-mapping sheet because UTM discipline has drifted across agencies and regions. The business needed answers, and people created them.
Over time, those workarounds become hidden infrastructure. The research paper behind Sigma Workbook, a spreadsheet-like interface for cloud data warehouses, captures why this pattern is so persistent: business users like spreadsheet interaction because it gives them flexibility, familiarity, and direct control over analysis.
A data analyst can study those trusted sheets and separate temporary exploration from recurring business logic. Some of that work should remain flexible, some should become governed reporting, and some reveals data-quality problems upstream.
In a very small company, the founder often understands performance through proximity. They know which customers matter, which sales calls are real, which employees are overloaded, which campaigns feel promising, and which complaints deserve attention.
Growth creates distance. More channels, products, customers, salespeople, regions, support tickets, pricing exceptions, and delivery teams make totals less useful because the meaningful truth begins moving into segments.
Shopify frames data analysis as a way for businesses to identify trends, reduce costs, and make smarter decisions, which is a simple way to understand why the analyst becomes strategic as growth adds complexity. Revenue may be increasing because one low-margin segment is expanding quickly.
Lead volume may be rising because a poor-fit geography is producing more inquiries. Customer count may improve while support burden rises faster. The analyst helps leadership see where growth is profitable, fragile, expensive, or misleading.
Departments usually see the company through the tools they live in every day. Marketing sees campaigns, sales sees opportunities, finance sees invoices, product sees usage, support sees tickets, and operations sees capacity. Each view can be accurate inside its own boundary and incomplete as a picture of the business. Leadership starts needing an analyst when it stops asking for departmental snapshots and begins asking how the chain works across the company.
GitLab’s public Product Analyst role description describes analysts as working with product teams to understand customer behavior across the journey and improve customer experience and business outcomes. That phrasing travels well beyond product teams.
A good analyst helps connect acquisition to sales quality, sales quality to revenue, revenue to margin, usage to retention, and support load to customer health. They help leaders see whether a strong-looking number in one department is creating pressure somewhere else.
A growing company eventually develops a phrase that should make leaders pause: can someone pull this? Can someone pull lead source by revenue, churn by acquisition channel, sales cycle by deal size, support complaints by product release, utilisation by client type, or pipeline ageing by sales rep? In moderation, those questions show curiosity. When they become a weekly operating rhythm, they show that recurring decisions have outgrown the current reporting setup.
The US Bureau of Labor Statistics projects 34 percent employment growth for data scientists from 2024 to 2034, which reflects how broadly organisations expect data work to matter. For a growing business, the practical lesson is closer to home. If managers repeatedly need bespoke analysis to run the company, the business needs someone accountable for turning recurring questions into better decision habits instead of treating every request as a one-off pull.
Many companies are moving from dashboards to automated insights, AI copilots, predictive lead scoring, churn models, forecasting tools, and natural-language analytics. That makes the analyst role more important. AI systems need clean questions, stable definitions, trustworthy historical data, and careful interpretation.
A lead-scoring model trained on inconsistent MQL definitions will learn inconsistency. A churn model trained on messy churn logic will produce fragile risk scores. A forecasting tool fed by stale pipeline data will scale stale assumptions faster.
LinkedIn’s Economic Graph frames AI as a force reshaping jobs and skills across the economy, and inside companies that shift creates more pressure on the quality of the data underneath decisions. The analyst becomes the person who protects the business question before it becomes an automation project. They ask whether the outcome label is clean, whether history is comparable, whether the metric is owned, and whether the proposed AI workflow supports a decision worth automating.
A data analyst is not always the first data hire. Sometimes the company is asking for analysis when the real bottleneck is infrastructure. If data cannot move reliably from CRM, billing, product, finance, support, or marketing systems, the business may need a data engineer or analytics engineer before it needs a full-time analyst.
At other times the data exists, but dashboards are duplicated, slow, poorly designed, insecure, or scattered across departments, in which case a BI developer may be the better first move.
| Business symptom | Likely first move |
| Data does not flow reliably from source systems | Data engineer or analytics engineer |
| Dashboards are slow, duplicated, or poorly governed | BI developer or BI-focused analyst |
| Reports exist but leaders cannot explain performance movement | Data analyst |
| Teams argue over KPI definitions | Data analyst plus business-owned metric governance |
| Leadership wants AI but cannot trust basic metrics | Data analyst with data-quality and engineering support |
| Spreadsheets are replacing official dashboards | Data analyst, with BI or engineering support depending on the cause |
The right hiring decision begins by naming the real bottleneck. Hiring a strong analyst into a broken data environment creates frustration, while hiring an engineer when the business already has usable data but no interpretation delays the decisions that need attention now.
A company that hires its first data analyst and immediately turns them into a dashboard factory wastes the role. The first 90 days should be about learning how the business actually works: the revenue model, customer journey, source systems, existing dashboards, trusted spreadsheets, recurring meetings, stakeholder frustrations, and the metrics people argue about most.
| Timeframe | Main focus | Useful output |
| First 30 days | Understand the business model, systems, meetings, dashboards, spreadsheets, and recurring decisions | Analytics audit, stakeholder question map, metric pain-point list |
| Days 31-60 | Validate core metrics and identify one or two decisions where analysis can change action | Source reconciliation, metric definitions, first diagnostic analyses |
| Days 61-90 | Turn recurring analysis into decision routines | Decision-ready dashboard improvements, recurring readouts, clearer ownership |
One analysis that changes how leadership understands lead quality, churn, margin, or pipeline risk is worth more than ten dashboards built to show that the hire is busy. The first analyst should leave the company with fewer unresolved questions, not merely more reports.
The best data analysts are structured thinkers before they are tool users. SQL matters, spreadsheets matter, BI tools matter, and depending on the business, Python, product analytics, CRM experience, finance understanding, or marketing analytics may matter as well.
A better interview gives the candidate a business situation: leads are up but revenue is flat, pipeline is growing but close rate is falling, churn rose in one segment, or support tickets dropped after a product release. The answer should reveal how they think, not just what software they know.
Google and Coursera’s Data Analytics Professional Certificate lists data cleaning, analysis, visualisation, spreadsheets, SQL, and Python among core skills, which is a useful baseline. The hire you want is the person who can use those skills to make business uncertainty smaller. Strong analysts behave a little like editors: they decide what belongs in the story, what evidence is strong, what is noise, which caveats matter, and where the reader should be careful.
A business should hire a data analyst when the cost of unclear decisions becomes higher than the cost of the role. That cost may appear as wasted ad spend, poor sales forecasting, margin surprises, slow operations, customer churn, manual reporting, KPI disputes, or leadership teams making confident decisions from incomplete evidence.
It also appears in softer forms: meetings that circle the same question, teams that do not trust one another’s numbers, managers who keep asking for another report, and dashboards that people open without changing what they do next.
The analyst does not remove uncertainty. The analyst reduces avoidable uncertainty. They help the business know which numbers are trustworthy, which patterns deserve attention, which questions require deeper work, and which decisions are being made from weak evidence.
The right time to hire is not when the company has data. Every company has data. The right time is when the company has important decisions that deserve better explanation than scattered dashboards, private spreadsheets, and instinct.
A business should hire a data analyst when recurring decisions are being made from numbers people do not fully trust or understand. The strongest signals are KPI disputes, spreadsheet workarounds, dashboard fatigue, unclear marketing or sales performance, weak forecasting, churn questions, and constant custom analysis before meetings.
A data analyst investigates business questions, validates metrics, studies patterns, reconciles sources, builds decision-ready views, and explains performance movement in language the business can use. Their value sits in making the next decision clearer.
A small business should hire a data analyst when leadership can no longer understand performance through direct observation and basic reports. Some companies can begin with a part-time analyst, consultant, or data-savvy operator before moving to a full-time hire.
Dashboards are no longer enough when they show movement without explanation. If teams keep asking why the number changed, whether the number is real, which source is correct, or what action should follow, the company needs analysis rather than more display.
A BI developer is the better first hire when dashboards are slow, duplicated, confusing, or poorly governed. A data analyst is the better first hire when reports already exist but leaders cannot explain performance movement or make confident decisions from the numbers.
A data engineer or analytics engineer should usually come first when data does not flow reliably from source systems. A data analyst should come first when the data is accessible enough but underinterpreted.
The first analyst should learn the business, map recurring decisions, review trusted spreadsheets, understand dashboards, identify disputed metrics, and find where decisions are slowed by uncertainty before building more reports.
SQL, spreadsheets, BI tools, data cleaning, basic statistics, and visualization matter, but reasoning matters more. A strong analyst can take a messy business question, ask the right clarifying questions, check the data honestly, and explain the next practical step.
The common mistake is hiring an analyst and using them only as a report producer. Another mistake is hiring an analyst before fixing the infrastructure needed to make data accessible and reliable.
A data analyst creates ROI by reducing wasted effort and improving decisions. The return often comes from avoiding bad budget moves, catching problems earlier, replacing recurring spreadsheet work, and giving leadership a clearer view of where the business is moving.
Aug 04, 2026 / 27 min read
Aug 04, 2026 / 22 min read
Jul 31, 2026 / 24 min read