
Too Many Dashboards: Why More Reports Do Not Mean Better Visibility
Jul 10, 2026 / 19 min read
July 10, 2026 / 19 min read / by Team VE
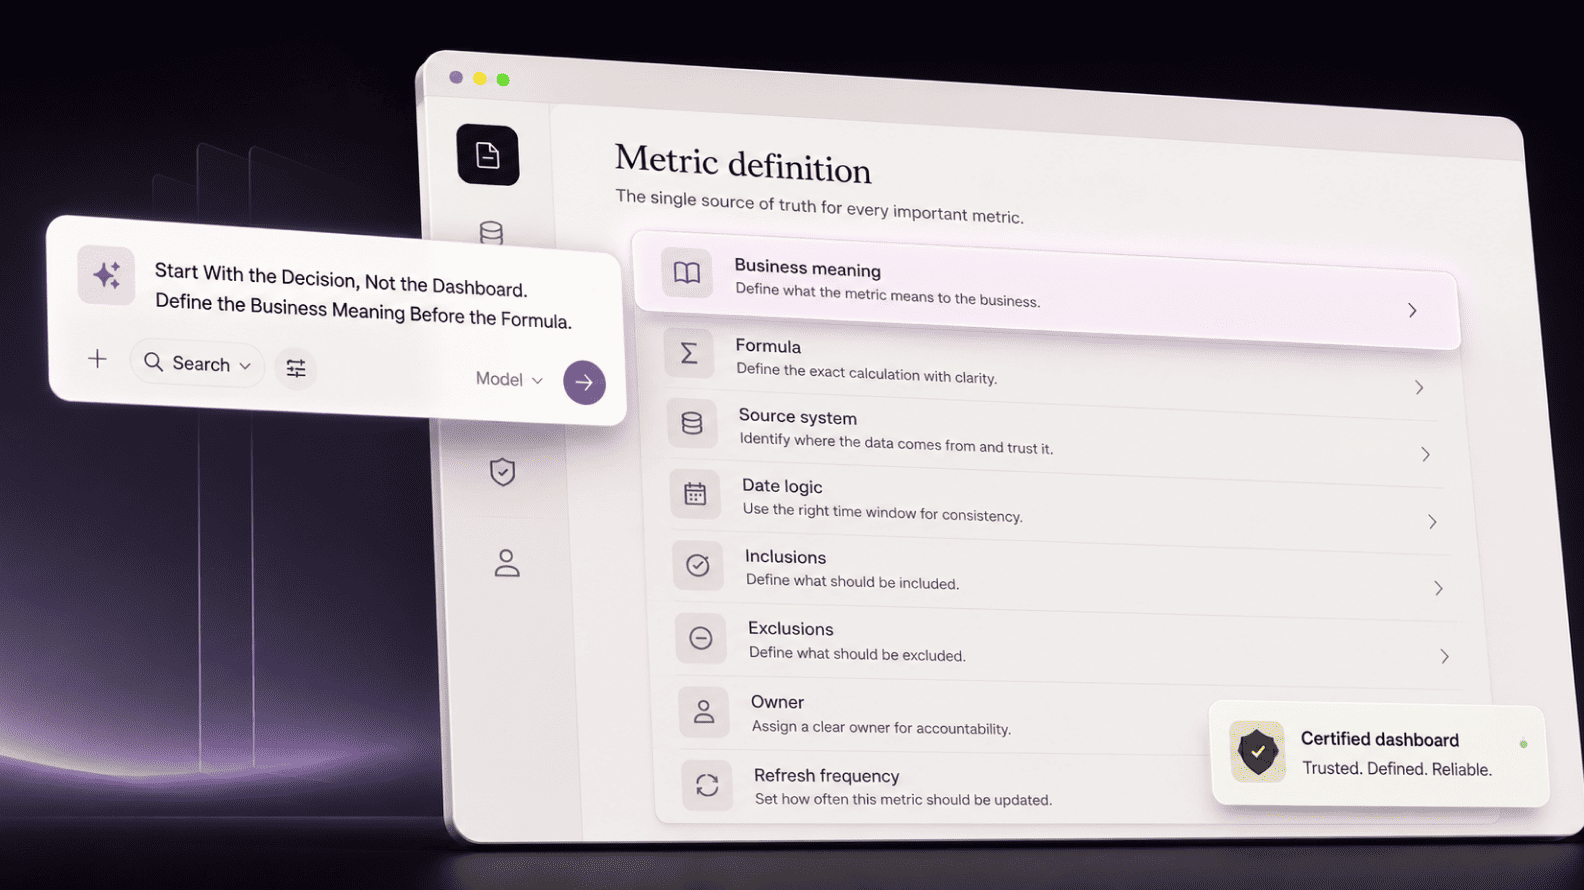
A business metric should be more than a clever formula hidden inside a dashboard. It should be a shared operating definition that tells the company what is being measured, why it matters, where it comes from, how it is calculated, and who has the authority to approve it.
Analytics teams should define business metrics by starting with the decision the metric supports, then documenting the meaning, formula, source, grain, date logic, rules, owner, refresh frequency, validation method, approved dashboard, limitations, and change history.
A KPI name alone is not a definition. Revenue, customer, conversion, active user, margin, churn, and qualified lead are only labels until the company agrees what each one means in practice.
Most dashboard disagreements begin because teams use the same word for different business events. Sales may use revenue to mean closed-won bookings. Finance may mean recognized revenue. Marketing may use conversion to mean a form submission, while sales may mean opportunity creation. Product may count any event as active usage, while customer success may care about actions that suggest renewal strength.
A good metric definition turns measurement into an operating system. The analytics team works with the business owner, validates the source, tests the calculation, publishes the definition where people work, and keeps it current as the business changes. Tools such as semantic layers, certified datasets, and metric dictionaries can enforce consistency, but they only help after the business meaning has been agreed.
A business metric is a defined measurement used to understand performance, guide decisions, or track progress against an objective. A complete definition includes business meaning, formula, source system, grain, date logic, rules, owner, refresh frequency, validation method, certified reporting location, limitations, and change history.
The trouble usually starts with a word that sounds too obvious to define. A leadership team sits down for a monthly review and someone says revenue is up. Sales are pleased because closed-won bookings improved. Finance is cautious because recognized revenue has not moved at the same pace.
The CEO asks whether collections have improved. Delivery is already thinking about whether the new contracts will require extra capacity before margin catches up. Nobody is twisting the number. Each person is reading a different stage of the same commercial story and using the same word to describe it.
Lead reporting creates the same kind of quiet confusion. Marketing says leads are up because more people filled the website form. Sales says the pipeline has not improved because fewer of those inquiries became qualified opportunities. In product meetings, active users can trigger another debate.
A product analytics dashboard may count every user who triggered an event, while customer success may only care about users who completed an action that suggests renewal value. The dashboard looked clean before the meeting. Once people attach decisions, targets, budgets, and accountability to the number, the looseness becomes visible.
Metric definition is therefore not admin work. It is how a company decides which version of reality it is going to manage. A vague metric lets every department bring its own interpretation into the room. A defined metric forces the business to choose the event that matters for a specific decision.
When you say revenue, do you mean booked, billed, collected, or recognized? When you say customer, do you mean account, payer, user, workspace, contract, or legal entity? When you say conversion, which stage of the journey has actually changed? These questions sound basic, but they are where many reporting systems lose trust.
Weak metrics are often born backward. A leader asks for a dashboard, the analytics team asks which KPIs should appear, familiar numbers are added, and the definition is patched together after the report has already become part of the management rhythm. The dashboard may look impressive, but it becomes a place where numbers are displayed rather than a tool that changes action.
A better starting point is the decision. If the metric supports a sales forecast review, the definition should help managers understand pipeline risk, stage movement, stale deals, close probability, and expected bookings. If it supports finance reporting, the definition needs period accuracy, revenue-recognition logic, refunds, credits, and auditability.
If it supports marketing budget allocation, the definition should connect spend to qualified pipeline or revenue rather than stopping at traffic and raw leads. The same label can require different definitions depending on the decision being made.
Analytics teams should ask four questions before writing a formula: who will use this metric, what decision will they make from it, what action should change when the metric moves, and how precise the metric needs to be. A daily operations metric may need freshness more than accounting-level reconciliation.
A board metric needs stable definitions. A campaign-monitoring metric may be directional, while a finance metric cannot be casual. Once the decision is clear, the source, date field, exclusions, grain, refresh cadence, and dashboard placement become easier to defend.
Companies often use metric, KPI, and operational metric as if they mean the same thing. The overlap is understandable, but the distinction matters because each type of measurement carries a different level of importance. A business metric may describe performance.
A KPI is a smaller set of measures tied directly to a goal or accountability rhythm. An operational metric helps a team run the work every day. Confusing them turns every number into a priority, which usually means no number is treated with enough care.
| Type | Purpose | Audience | Examples | When to use it |
| Business metric | Measures a defined part of performance or behavior. | Business teams, analysts, managers. | Revenue, lead volume, active users, churn rate, gross margin. | Use when the company needs a shared measurement for a recurring business area. |
| KPI | Tracks progress against a strategic or operational goal. | Leadership, department heads, accountable owners. | Qualified pipeline contribution, net revenue retention, sales win rate, contribution margin. | Use when the metric is important enough to influence targets, reviews, budget, or incentives. |
| Operational metric | Helps a team manage day-to-day work. | Team leads, operators, frontline managers. | Ticket backlog, failed payments, campaign spend pacing, overdue follow-ups. | Use when teams need fast signals to adjust execution before the next formal review. |
A formula can create the illusion of precision before the company has agreed what should be measured. Conversion rate sounds simple until the denominator and numerator are examined. A website team may define conversion as a form submission.
Marketing may define it as a qualified lead. Sales may define it as opportunity creation. Product may define it as activation. Finance may define it as a paid purchase. Each calculation can be correct and still answer a different business question.
The analytics team should first write the metric in plain business language. A useful definition would say, “Sales-qualified lead conversion rate measures the percentage of marketing-qualified leads accepted by sales and converted into SQLs within 30 days of MQL creation.” That sentence clarifies stage, denominator, event, time window, and ownership. The formula then becomes implementation detail rather than a substitute for agreement.
The definition should also explain what the metric should not be used for. Bookings are useful for sales momentum, but they are not recognized revenue. Raw leads are useful for campaign volume, but they are not evidence of sales-ready demand.
Logins may show that instrumentation works, but they may not prove product value. A strong metric dictionary does more than describe the calculation. It tells users which decisions the metric can support and where it becomes misleading.
A metric becomes unstable when teams can choose whichever source fits their workflow. Revenue is the easiest example. The CRM may hold closed-won opportunities, the billing system may hold invoices, the payment processor may hold collections, and the finance system may hold recognized revenue. None of these systems is automatically wrong. They represent different points in the revenue lifecycle. The definition must specify which source owns which version.
The phrase single source of truth is often used too casually. Many companies need a source-of-truth map. CRM can have its own pipeline. Billing can own invoices. Finance can own recognized revenue. Product analytics can own usage events. Support systems can own ticket behavior. The warehouse and semantic layer then reconcile those sources, document the lineage, and expose the approved version for reporting.
The practical flow usually looks like this: source system to warehouse to semantic layer to dashboard to executive report. Consistency is enforced in the middle, not at the final chart. Microsoft describes Power BI semantic models as data ready for reporting and visualization, while Google has described Looker’s semantic model as a way to define metrics once and use them everywhere for governance and trust.
The tool choice can vary, but the principle stays the same: the definition should be controlled before it spreads into dashboards, spreadsheets, AI assistants, and executive decks.
Many metric disputes come from date logic hidden inside filters. A customer may first submit a form in March, become an MQL in April, turn into an opportunity in May, close in June, get invoiced in July, pay in August, and generate recognized revenue over the next year.
Marketing may report the customer in March, sales in June, billing in July, and finance across the recognition period. The teams are answering different time questions. The metric definition should say which one is approved for the decision at hand.
Grain is just as important. It defines the unit being counted. Customer can mean user, account, workspace, payer, contract, or legal entity. Revenue can be calculated at invoice level, line-item level, subscription level, account level, or opportunity level. Conversion can be session-level, user-level, lead-level, opportunity-level, or account-level. If the grain is missing, joins can duplicate revenue, inflate campaign influence, or make customer counts drift between reports.
The definition should name the reporting date and the counting unit clearly. Churn by cancellation-request date is different from churn by contract-end date. Active users by calendar month is different from rolling 30-day activity. Average revenue per customer is only meaningful when the revenue grain and customer grain match. These details may sound technical, but they decide the business story the metric tells.
The most misleading metrics are often not broken by the formula. They are broken by unclear scope. A revenue metric may exclude taxes but include discounts. Another may remove refunds and credits. A lead metric may include students, vendors, spam, duplicate submissions, and internal tests. Another may count only verified business inquiries. A product metric may remove internal users and bots. Another may quietly include them because nobody documented the exclusion.
A good metric definition states the rules in plain language. If internal users are removed from active-user counts, say so. If cancelled invoices are excluded, say so. If duplicate leads are deduplicated by email and company domain, say so. If free-trial users are excluded from customer count, say so. Important metrics leave little room for hidden assumptions.
These rules should be visible in the metric dictionary and, for high-use dashboards, reachable from the report itself. Users should not have to ask the analyst whether revenue is gross or net, whether leads include spam, or whether customer count includes trials. When exclusions are hidden, dashboards become arguments waiting for review.
A metric without an owner will drift because the business itself keeps changing. Pricing changes, sales stages change, product events change, campaign structures change, finance rules change, and new customer types appear. If nobody owns the definition, nobody knows when the metric needs review. The dashboard keeps running, but it slowly measures an older version of the business.
Ownership should follow business meaning. Finance owns recognized revenue and margin logic. Sales owns pipeline stage logic. Marketing and sales jointly own lead handoff definitions. Product owns activation and meaningful usage.
Customer success owns account-health logic, often with finance involved in churn and retention. The analytics team owns implementation, validation, documentation, and consistency, but it should not become the only authority on business meaning.
A metric owner should approve the definition, resolve disputes, review changes, communicate updates, and decide when old versions should be retired. With ownership, the metric dictionary becomes an operating agreement the business can rely on.
A metric dictionary should not read like a school glossary. “Revenue is income from customers” is almost useless because it does not tell anyone which revenue, which source, which date, which exclusions, which owner, or which decision.
A strong entry would say that recognized revenue is sourced from the finance system, reported by recognition period, excludes taxes and refunded amounts, follows approved finance logic, is owned by the finance team, refreshes after monthly close, and is the official revenue metric for board reporting.
| Definition element | What to specify | Example |
| Metric name | Official name used in dashboards. | Sales-qualified lead conversion rate. |
| Business meaning | Plain-language explanation of what is being measured. | Share of MQLs accepted by sales and converted into SQLs. |
| Decision supported | Where the metric is used. | Weekly sales and marketing funnel review. |
| Formula | Exact calculation. | SQLs created within 30 days of MQL date divided by MQLs created. |
| Source system | Approved source of the raw data. | CRM lifecycle-stage history table. |
| Grain | Unit of measurement. | Lead record, deduplicated by email and company domain. |
| Date logic | Date field and window used. | MQL created date, calendar month. |
| Inclusions and exclusions | Records that count and records that are removed. | Valid business inquiries only, excluding spam, vendors, students, test leads, and duplicates. |
| Owner and refresh | Who approves it and how often it updates. | Joint owner: Head of Marketing and Head of Sales. Daily refresh. |
| Validation and limitations | How accuracy is checked and what users should not assume. | Monthly CRM reconciliation. Does not measure closed-won revenue contribution. |
| Change history | Version notes and approval trail. | Qualification window changed from 45 days to 30 days on June 1, 2026. |
A definition hidden in a document nobody opens will not change behavior. Users do not pause a meeting to search a wiki. They look at the dashboard in front of them, copy a number into a deck, or ask an AI assistant to explain the trend. If the approved definition is not close to that workflow, people will apply their own meaning.
Good governance is partly a user-experience problem. Definitions should appear in dashboard tooltips, KPI cards, certified datasets, BI descriptions, semantic models, or a metric dictionary linked directly from the report.
dbt describes its Semantic Layer as a way to define critical metrics in the modeling layer so downstream tools can use consistent logic, while Microsoft’s Power BI endorsement model exists because users often struggle to identify trustworthy and authoritative content when many reports and semantic models are available. The same logic applies to metric definitions: make the trusted version easy to find, or unofficial versions will fill the gap.
AI tools make this even more important. SQL copilots, dashboard assistants, documentation generators, and natural-language analytics can speed up query writing, dashboard creation, and exploration, but they depend on the definitions they can access. If revenue is vague in the semantic layer, an AI assistant will not magically understand the CFO’s meaning. It may simply produce a faster version of the wrong answer.
A metric should not become official until the calculation has been tested against real records. The analytics team should reconcile totals with the approved source, review samples, test edge cases, check duplicate logic, validate date behavior, and confirm that the owner agrees with the result.
For revenue, finance should test refunds, credits, multi-currency cases, and period logic. For qualified leads, sales and marketing should test rejected leads, accepted leads, duplicate inquiries, and recycled leads. For active users, the product should test internal users, bot events, passive events, and account mapping.
Validation cannot stop at launch. Important metrics should be monitored for schema changes, broken pipelines, refresh failures, unusual KPI movements, and source-system logic changes. A CRM field can be renamed, a product event can stop firing, a pipeline can load late, or a filter can remove a segment by mistake. Users usually discover these failures at the worst time, when a number is already being discussed by leadership.
A simple lifecycle keeps the work manageable: define, review, approve, implement, validate, publish, monitor, version. The final step matters because metrics age. If active-user logic changes from any event to meaningful event, the historical trend may drop even though the product did not suddenly weaken. If revenue changes from gross to net, older reports may no longer be comparable. Change history tells users whether the business moved or the measurement changed.
Metric governance becomes counterproductive when it tries to flatten every team’s work into one universal number. Sales needs bookings and pipeline coverage. Finance needs recognized revenue and margin. Marketing needs raw leads, valid leads, MQLs, SQLs, and pipeline contributions.
Product needs activation, retention, meaningful active users, and feature adoption. Customer success needs account health, renewal risk, churn, and expansion signals. These measures do different jobs.
The goal is clarity. Company-standard metrics should be certified for leadership decisions. Team-operating metrics should help departments manage their work. Exploratory metrics should help analysts investigate new questions before they become official. Trouble begins when an exploratory or departmental metric travels upward without a label and starts competing with the company-standard version.
Booked ARR and recognized revenue can both exist. Raw conversion rate and qualified conversion rate can both exist. All active users and meaningful active users can both exist. The label should carry enough meaning that users know which decision each number can support. Good governance gives useful local metrics room to breathe while preventing them from pretending to be official company truth.
The cleanest test of a metric definition is simple. Give the definition to two analysts and ask them to calculate the metric independently from the same source. If they produce different numbers, the definition is not clear enough. The test quickly exposes vague language around active customers, net revenue, qualified lead, churned account, and meaningful usage.
A well-defined metric reduces interpretation. It says what counts, what does not count, where the data comes from, which date is used, what unit is counted, who owns the definition, and where the certified version appears. If those details are missing, the metric will behave differently across dashboards no matter how polished the reports look.
Analytics teams should treat metric definitions as product work. The users are business teams. The product is a number they can trust. Documentation, validation, ownership, monitoring, and versioning are not bureaucracy. They are what makes the number usable.
The framework is straightforward: decision, definition, source, validation, ownership, and governance. When that chain is clear, the company spends less time debating vocabulary and more time understanding performance.
Start with the decision, then document the business meaning, formula, source, grain, date logic, inclusions, exclusions, owner, refresh cadence, validation method, certified dashboard, limitations, and change history. A good definition should let two analysts calculate the same result independently.
It should include the official name, plain-language meaning, business purpose, formula, source, grain, date field, rules, owner, refresh cadence, validation method, certified dashboard, limitations, and change history. It should also say where the metric should not be used.
A metric is any defined measurement. A KPI is a metric important enough to track progress against a goal. Website sessions may be a metric, while qualified pipeline contribution may be a KPI if leadership uses it to judge demand quality.
Teams measure different stages of work. Sales cares about bookings, finance about recognized revenue, marketing about qualified demand, product about activation, and customer success about retention. Different versions are fine when labels and approved use cases are clear.
The owner should be the function responsible for the metric’s meaning. Finance owns recognized revenue, sales owns pipeline stages, product owns activation, and customer success owns account health. Analytics owns implementation quality, testing, documentation, consistency, and monitoring.
Semantic layers centralize approved metric logic so dashboards, spreadsheets, notebooks, embedded analytics, and AI assistants can use consistent definitions. They still need agreed business meaning first; they enforce meaning, they do not create it.
Validate by reconciling with the approved source, reviewing samples, testing duplicates, checking date behavior, confirming exclusions, and getting owner approval. After launch, monitor refresh failures, schema changes, broken events, late-arriving data, and unusual KPI shifts.
Review important metrics after process changes and on a regular cycle, often quarterly or twice a year. CRM changes, product event changes, pricing changes, new regions, new customer types, reporting disputes, and dashboard rebuilds should trigger review.
Yes. Booked revenue, billed revenue, collected cash, and recognized revenue can all be valid. The discipline is in the label, owner, and approved use case, so users know which decision each version supports.
A good definition is clear, owned, testable, source-specific, date-specific, grain-specific, and decision-specific. If two teams can calculate the same number from the same source using the definition, the metric is ready to be trusted.
Jul 10, 2026 / 19 min read

Jul 10, 2026 / 16 min read
Jul 10, 2026 / 15 min read