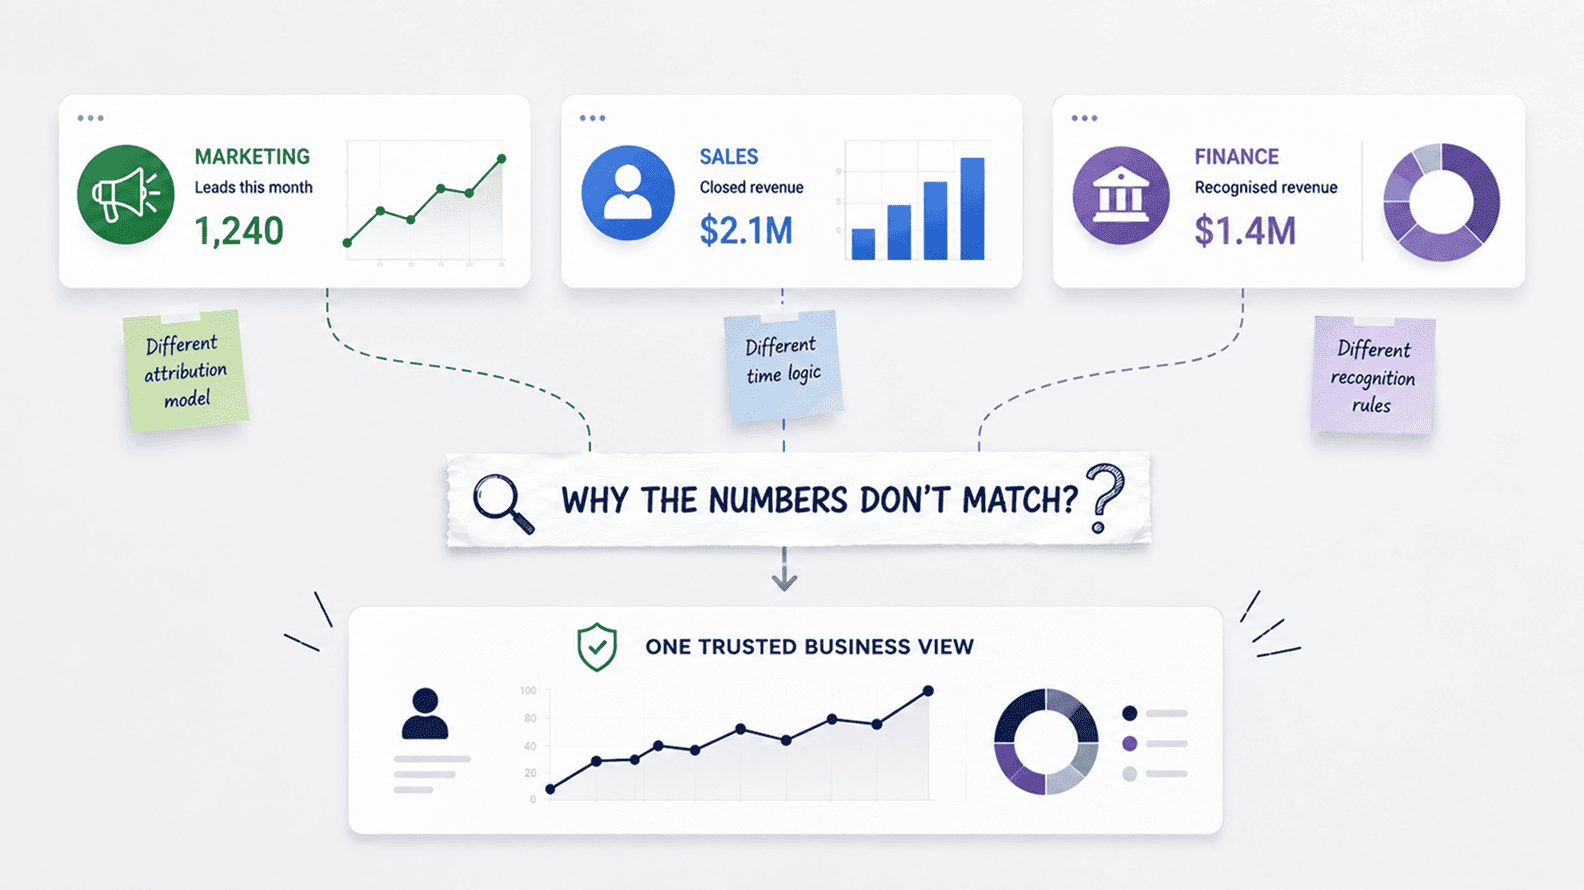
Why Marketing, Sales, And Finance Reports Do Not Match
Aug 04, 2026 / 27 min read
July 10, 2026 / 18 min read / by Team VE
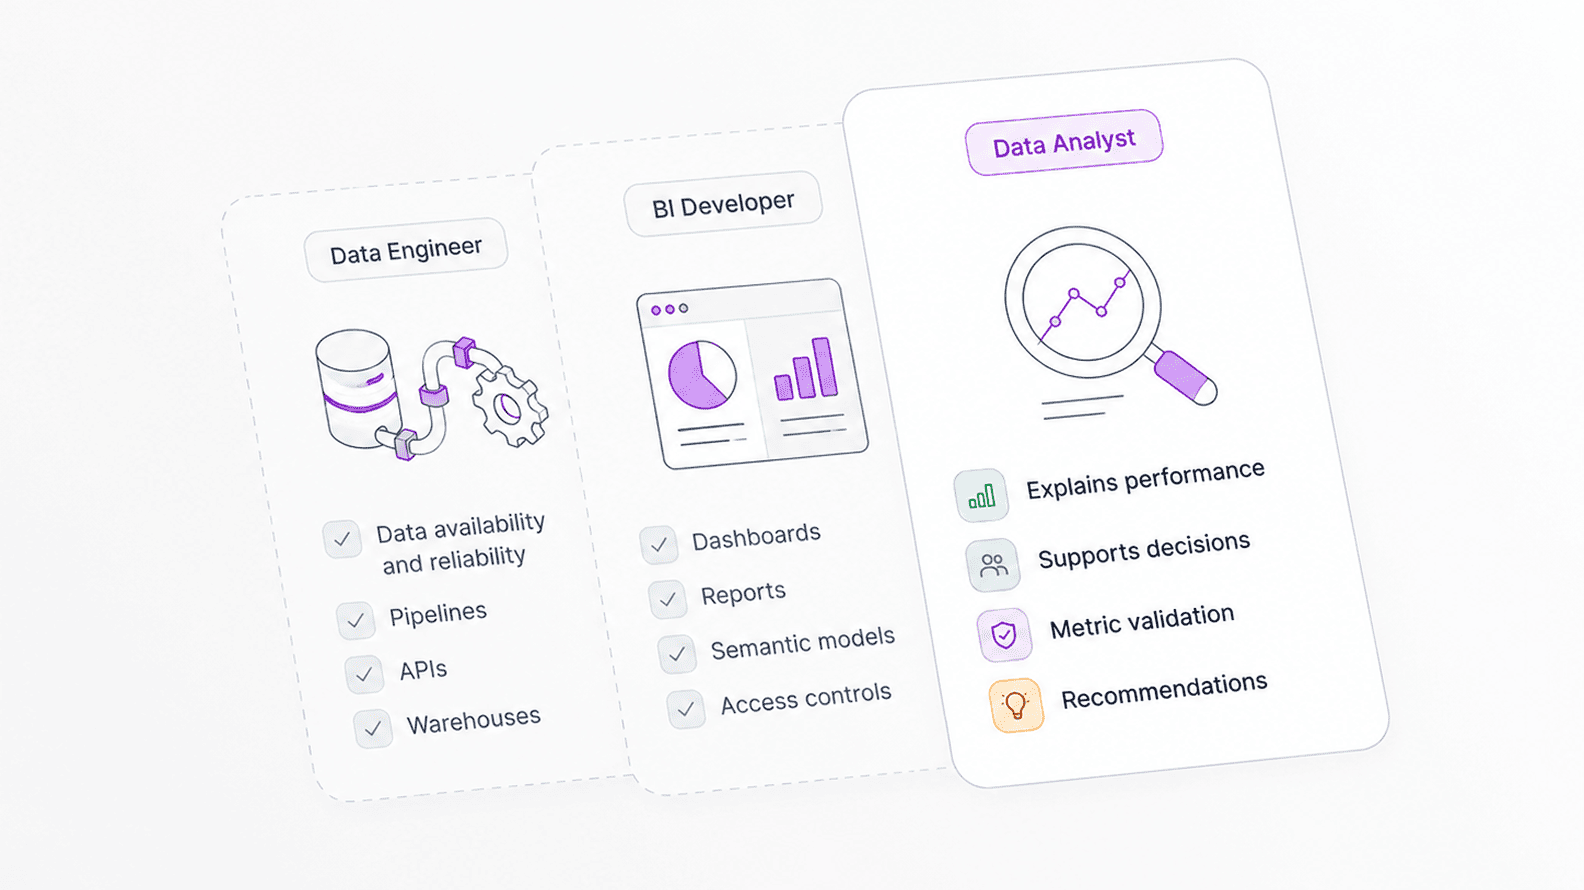
Companies often hire for ‘data’ as if it is one job. The person who moves the data, the person who turns it into governed dashboards, and the person who explains what the numbers mean are solving different business problems.
A data engineer builds the foundations that make data available, reliable, secure, and usable at scale. They work on pipelines, storage, source integrations, orchestration, schemas, data quality checks, cloud platforms, monitoring, and performance.
The Google Cloud Professional Data Engineer certification frames the role around designing data processing systems, ingesting and processing data, storing it, preparing it for analysis, and maintaining automated data workloads, which is a good shorthand for the kind of reliability work most business users never see.
A BI developer builds the reporting layer that business users actually experience. They work with tools such as Power BI, Tableau, Looker, and Qlik to create semantic models, dashboards, reports, measures, drill-downs, access controls, and certified reporting views. Microsoft’s Power BI service basics describe workspaces, reports, dashboards, apps, roles, sharing, and semantic models, which is close to the daily world of BI development rather than simple chart-making.
A data analyst turns numbers into business understanding. They investigate why a KPI moved, check whether the movement is real, explain what is driving the change, and help teams decide what to do next. The role focuses on supporting decision-making, client engagements, and business operations through reporting, data mining, and data visualization. The important phrase is decision-making, because a chart without interpretation rarely changes how a company behaves.
The confusion happens because business users usually meet all three roles through one screen: the dashboard. Behind that screen, someone had to move the data, model it, build the report, validate the metric, and interpret the result.
In smaller companies, one capable person may cover several layers. As the business grows, the lack of clear ownership starts showing up as stale dashboards, disputed KPIs, slow reports, manual spreadsheet work, and meetings where everyone looks at the same chart but reaches different conclusions.
A data analyst explains business performance through data. A data engineer builds the systems that move, store, prepare, and protect data. A BI developer builds the reporting experience that lets teams consume data through dashboards, semantic models, governed reports, and interactive views. The roles overlap in tools, especially SQL and BI platforms, but their accountability is different.
A leadership dashboard looks deceptively simple. It may show sales pipeline, revenue, lead quality, product usage, customer churn, and support backlog on one page. To a CEO or department head, it feels like one product, one number system, one output from the ‘data team’. Under the surface, that dashboard is the final stop in a longer chain of work.
Business data usually starts inside operational systems: a CRM, billing tool, product database, ad platform, finance application, support desk, or ERP. Data engineering moves that data into an analytical environment, handles syncs and schema changes, and keeps the supply chain stable.
Analytics engineering, where the company has that role, turns raw tables into business-ready models with tested joins, definitions, and logic. BI development turns those models into dashboards, reports, permissions, filters, and drill-downs that people can actually use. Data analysis then interprets the movement and connects it to a decision.
Consider a weekly pipeline review. The dashboard shows open opportunities by stage, expected close date, owner, segment, region, and deal value. Before anyone can debate the number, data has to leave the CRM correctly.
Integrations need to work, API limits need to be handled, fields need to sync, schemas need to remain stable, and the warehouse needs the latest records. If the CRM field stopped syncing overnight, redesigning the dashboard will not fix the meeting.
The raw data also has to become reportable. Opportunity stages need grouping. Test records need exclusion. Old deals may need stale-deal logic. Close-date fields need a standard definition. Pipeline value needs measures. Sales managers need filters and drill-throughs. A report can have correct source data and still fail if it is slow, cluttered, poorly secured, or impossible to interpret in the rhythm of a real sales meeting.
Then the business asks what the number means. Pipeline value may be up, but late-stage deals may be aging, lead quality may be weakening, close dates may be slipping, and one region may be over-forecasting. A dashboard can show the surface movement.
Someone still has to investigate the pattern, compare it with history, check whether the movement is real, and explain the decision risk. One screen can hide four different kinds of work, and that is where vague data hiring starts to break down.
The data engineer works closest to the machinery. Their job is to make sure data can move from operational systems into analytical environments reliably, securely, and at the right scale. In a small company, that may mean pulling CRM and billing data into a warehouse. In a larger company, it can mean pipelines across product events, marketing tools, customer platforms, finance systems, data lakes, warehouses, orchestration layers, and monitoring systems.
A useful way to think about the data engineer is to imagine the company’s data supply chain. If the business needs leads from HubSpot, opportunities from Salesforce, invoices from Stripe, product events from an application database, support tickets from Zendesk, and finance entries from an ERP, someone has to build the routes that bring all of that into one controlled environment. The engineer has to think about authentication, rate limits, incremental loads, late-arriving records, schema drift, failure alerts, permissions, and cost.
Good data engineering often feels invisible because it creates boring reliability. Nobody celebrates a pipeline that ran at 3 a.m., a warehouse table that loaded cleanly, or a schema change that was handled before the Monday report refreshed.
People notice the engineer when yesterday’s numbers are missing, the CFO sees revenue stop updating, or a dashboard takes two minutes to load. The best engineering work gives analysts and BI developers a stable floor to stand on.
Many companies assume a data analyst can absorb this work forever. Some analysts can write SQL, automate small reports, and build light data pulls, but production data movement is a different discipline. It asks what happens when a job fails, when data volume doubles, when a vendor changes an API, when a table needs backfilling, when sensitive fields require masking, and when ten dashboards depend on the same pipeline. That is engineering work, not a spare-hour task.
If the data engineer builds the supply chain, the BI developer builds the reporting room where business users meet the data. Good BI development is not the act of dragging fields into charts. It is the craft of turning modeled data into a reporting environment that people can use without misreading it.
The BI developer works with platforms such as Power BI, Tableau, Looker, Qlik, or similar tools. They build semantic models, define measures, design report pages, create drill-through paths, manage filters, control access, optimize performance, publish apps or workspaces, and help users find the right report.
Microsoft’s Power BI semantic model documentation and Google’s Looker documentation on LookML both point to the same deeper idea: the reporting layer needs a governed model of dimensions, measures, calculations, and relationships, not just a collection of attractive visuals.
A strong BI developer understands that dashboards are interfaces for decisions. A CFO does not need the same view as a sales manager. A sales manager does not need the same view as a rep. A marketing head does not need twenty vanity metrics when the real question is whether spend is producing qualified pipeline. A support leader does not need a beautiful backlog chart if it hides freshness, channel coverage, and SLA breach risk.
The BI developer also protects users from the dashboard itself. Too many visuals create noise. Hidden filters create mistrust. Slow reports kill adoption. Poorly named measures create interpretation problems. Weak access rules create risk. A report that looks impressive in a demo can fail in daily use because it does not fit how the team actually works.
The data analyst works closest to the business question. Their work begins where the dashboard stops. A dashboard can show that qualified leads fell in May. The analyst asks whether the fall came from one channel, a tracking change, stricter qualification rules, weaker campaigns, sales follow-up delays, seasonality, or a real demand problem.
A dashboard can show revenue growth. The analyst asks whether margin improved, whether refunds increased, whether collections followed, whether growth came from one large deal, and whether the movement is repeatable. A dashboard can show active users rising. The analyst asks whether that activity reflects meaningful product value or passive events that flatter the metric without changing customer behavior.
The analyst may use SQL, Excel, Python, R, BI tools, statistics, notebooks, and visualization. The toolset matters, but judgment matters more. A good analyst knows that a 20 percent increase may mean little if the base is tiny, that averages can hide segment problems, that a dashboard trend can come from a tracking change, and that a technically correct metric can still mislead a commercial team.
The analyst needs proximity to the business because the harder questions are rarely answered by data alone. They need to understand incentives, definitions, operating context, and what teams are likely to do with an answer. Their value is not a chart. Their value is the ability to explain what changed, how confident the company should be, and what decision deserves attention.
The three roles overlap in tools, which is why companies confuse them. A data analyst may use SQL. A data engineer may use SQL. A BI developer may use SQL. All three may touch a warehouse. All three may work with dashboards. Tools do not define the role. Accountability does.
The data engineer is accountable for data availability and reliability. If records do not arrive, pipelines fail, APIs break, schemas drift, jobs run late, or performance collapses under scale, the engineer is closest to the problem. The BI developer is accountable for the reporting layer. If users cannot find the right dashboard, measures are inconsistent, access is wrong, visuals confuse users, or reports are slow, the BI developer is closest to the problem.
The data analyst is accountable for interpretation. If leaders do not know why a KPI moved, whether the movement is real, what changed underneath it, or what decision should follow, the analyst is closest to the problem.
The practical question is not ‘Which data tool do we need?’ It is ‘Which part of the data chain is failing?’ Once that is clear, the job title becomes easier to choose.
Modern data teams often include a fourth role because the gap between engineering and analysis became too wide. The analytics engineer usually works after raw data has landed but before it reaches analysts, BI developers, and business users. The role turns raw warehouse tables into clean, tested, documented, business-ready models.
The dbt Analytics Engineering Certification describes the work around building, testing, and maintaining models for data accessibility while applying engineering principles to analytics infrastructure. In practice, the data engineer gets CRM, billing, product, and support data into the warehouse.
The analytics engineer turns those raw tables into models such as fact_revenue, dim_customer, fact_opportunities, fact_product_usage, or customer_health_snapshot. The BI developer builds reports on top of those models. The data analyst investigates performance using the same trusted base.
AI tools now sit across the data workflow. SQL copilots can help analysts draft queries faster. Dashboard assistants can suggest visuals or generate first-pass reports. Documentation generators can summarize table logic. Natural-language analytics tools can let a business user ask a question without writing SQL.
Snowflake’s Snowflake Cortex Analyst documentation describes a managed LLM-powered feature for answering business questions on structured data, while Tableau Pulse focuses on detecting drivers, trends, and outliers and summarizing them with natural-language explanations.
These tools are useful, but they do not erase the difference between the roles. An AI assistant can draft SQL against the wrong table if the semantic layer is weak. It can produce a neat chart from stale data if pipelines are broken.
It can summarize a trend without understanding sales compensation changes, a new pricing rule, a finance cut-off, or a tracking migration. AI improves speed when the foundations are sound. It adds risk when companies use it to cover unclear definitions, poor governance, or weak human review.
The CEO says, ‘Our dashboards are useless.’ The sentence sounds clear, but it can mean several different things.
It may mean pipelines are failing, dashboards are stale, source systems are not syncing, and analysts are stuck exporting CSVs.
It may mean the reporting layer is messy, duplicated, slow, or impossible to govern. It may also mean leaders can see the numbers but cannot understand why they moved or what decision should follow. The same complaint can point to data engineering, BI development, or data analysis, so the first hiring question has to be diagnostic.
Many hiring mistakes come from failing to diagnose the real complaint. A data analyst hired into an engineering problem spends too much time fixing pipelines. A data engineer hired into an interpretation problem builds infrastructure but does not answer leadership’s questions. A BI developer hired into a metric-governance problem creates cleaner dashboards with the same disputed numbers. Hire for the bottleneck, not the buzzword.
Take a customer health dashboard. The business wants to know which accounts are at risk before renewal. It sounds like a dashboard request, but the work cuts across several roles.
The engineer has to bring together product usage, support tickets, CRM account data, billing status, contract value, and renewal dates. The analytics engineer may turn that raw material into tested account-level models. The BI developer designs the customer health view, filters, drill-throughs, permissions, and performance.
The analyst works with customer success to decide what ‘at risk’ means, whether declining usage predicts renewal trouble, and which signal should trigger action.
Most role comparisons focus on tools and salaries. Those details matter, but they do not help a leadership team diagnose its data function. The more useful comparison is where each role creates trust.
| Area | Data Analyst | Data Engineer | BI Developer |
| Core responsibility | Explains performance and supports decisions. | Builds reliable data infrastructure and pipelines. | Builds governed reports, dashboards, and semantic models. |
| Main question | What does this data mean for the business? | Can the data move, scale, and stay reliable? | Can users consume this data clearly and safely? |
| Typical work | Analysis, metric validation, stakeholder communication, recommendations. | Ingestion, orchestration, warehouses, APIs, monitoring, security. | Dashboard design, measures, semantic models, report performance, access controls. |
| Output | Insights, explanations, recommendations. | Reliable tables, pipelines, platforms, and data flows. | Dashboards, reports, governed models, and interactive views. |
| Failure if missing | Reports exist, but understanding is weak. | Questions exist, but data supply is unreliable. | Data exists, but reporting adoption is poor. |
Startups usually need a practical generalist first, because the early data stack is rarely clean enough for narrow specialization. One person may need to connect source systems, write SQL, build basic dashboards, and explain performance to founders. The important point is to hire someone who is honest about trade-offs. A startup generalist can cover the chain lightly, but they should not pretend that a few manual exports equal a scalable data foundation.
Scale-ups need to hire around the biggest operating bottleneck. If data is trapped in systems, arrives late, breaks often, or cannot be combined across CRM, billing, product, and finance, data engineering should come first. If the warehouse exists but every team has a different version of revenue, customer count, or pipeline, analytics engineering may be the missing layer.
If leaders have reports but still do not know why performance changed, a data analyst can create more commercial value than another dashboard builder.
Enterprise organizations usually need clearer role separation because the cost of confusion is higher. Data engineering has to handle reliability, scale, security, and platform governance. BI development has to manage certified reporting, permissions, performance, and adoption across departments.
Analytics engineering has to keep the semantic and transformation layer disciplined. Data analysts need enough business proximity to challenge assumptions rather than simply service ticket requests.
The real difference between a data analyst, data engineer, and BI developer is the part of the data system they are responsible for making trustworthy. The data engineer makes the supply trustworthy. The BI developer makes the reporting experience trustworthy. The data analyst makes the interpretation trustworthy.
A data analyst explains what business data means. A data engineer builds the systems that move, store, and prepare data. A BI developer builds the dashboards, reports, semantic models, and reporting experiences that business users consume. They may share SQL and BI tools, but their accountability is different.
A data analyst investigates business questions, validates metrics, studies patterns, explains KPI movement, and helps teams make better decisions. The core skill is judgment: understanding what changed, why it changed, how confident the company should be, and what action deserves attention.
A data engineer builds and maintains the data infrastructure that analytics depends on. They work on pipelines, source integrations, orchestration, warehouses, APIs, data quality checks, monitoring, security, and performance. Without that foundation, dashboards become stale, incomplete, slow, or manually maintained.
A BI developer builds the reporting layer: dashboards, reports, semantic models, measures, filters, drill-throughs, access rules, and published BI content. The role is partly technical and partly user-focused because business teams need reports they can trust and use correctly.
The roles overlap, but they are different. A BI developer focuses on reporting usability and governance. A data analyst focuses on investigation and interpretation. One person may cover both in a smaller company, but the responsibilities should still be understood separately.
An analytics engineer sits between data engineering and analysis. They turn raw warehouse data into clean, tested, documented, business-ready models that analysts and BI developers can use. The role becomes valuable when metrics differ across dashboards or raw data exists without a trusted business layer.
Hire for the bottleneck. If data is missing, stale, duplicated, or hard to combine, start with data engineering. If reports are slow, cluttered, confusing, or ungoverned, start with BI development. If dashboards exist but leaders still do not know what the numbers mean, start with data analysis.
One person can cover parts of all three, especially in a startup or small business. As the company grows, the work becomes harder to combine because pipelines need reliability, dashboards need governance, and analysis needs business depth.
AI tools can speed up query drafting, dashboard prototyping, documentation, and exploratory analysis. They can assist each role, but they still depend on reliable data, clear metric definitions, governed semantic models, and human review.
Aug 04, 2026 / 27 min read
Aug 04, 2026 / 22 min read
Jul 31, 2026 / 24 min read