Data Mining in Machine Learning: 7 Skills Every Data Scientist Should Know
Data scientists have a background in mathematics and statistics. With this background, they create advanced analytics. At the pinnacle of this advanced math, they work on machine learning models and AI. However, as with every other product or service, a business side is always involved. This includes understanding data mining in machine learning enough to get business insights. Data scientists are often tasked with the analysis of data coming in, and this requires a basic business acumen at the very least.
Apart from this, the inferences they reach need to be presented to the non-technical audience with verbal and visual aesthetics to initiate action. Thus, it’s very crucial for any aspiring data scientist to understand data mining to make the best use of their skills in the industry.
Data Mining in Machine Learning – 7 Essential Functionalities
Data mining involves finding trends to predict and characterize data. Broadly, it is categorized as descriptive and predictive data mining.
A. Descriptive data mining
The aim here is to provide knowledge about what’s happening within a dataset without having any prior idea. Descriptive data mining provides insights about general properties present in the database such as count, average, etc.
B. Predictive data mining
This type of data mining involves understanding implicit characteristics such as forecasts for the next quarter with respect to the performance of the previous quarters. Predictive analysis infers characteristics with the existing data.
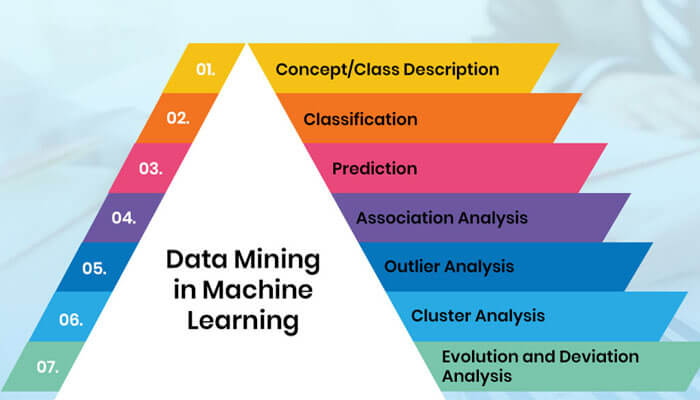
There are 7 main functionalities:
- Concept/class description: Characterization and discrimination
- Classification
- Prediction
- Association analysis
- Outlier analysis
- Cluster analysis
- Evolution and deviation analysis
Let’s know more about these in detail.
Characterization and Discrimination in Data Mining – Class/Concept Description
Q: What kind of goods are sold in a hardware shop?
A: Nuts and bolts, screwdrivers, repair kits, and other machinery.
Do you see how related items belong to a single set? The same is true for classes or concepts in data if they are to be correlated with results. To achieve this, the two functionalities used are characterization and discrimination in data mining.
1.1 Data characterization
This is a description of the key characteristics of all objects in a particular class. It is a summary of all the general features of a dataset and produces characteristic rules for the target class. Data scientists run database queries to compute the specified class with predefined modules for retrieving desired results at various abstraction levels.
Eg: Pie charts, bar maps, and curves.
1.2 Data discrimination
This compares the data between two classes by mapping the target class with a predefined class. Data discrimination creates a series of rules known as discriminate rules that are a distinction between two classes aligned with the goal class and the opposite class of the objects with general characteristics.
Classification
This functionality is used to predict trends in the data. Classification creates datasets through predefined classes by using methods like decision trees, neural networks, IF-THEN, or mathematical formulae. These datasets are then used for predicting or analyzing a model.
Eg: Classifying employees based on their experience in a company.
Difference between discrimination and classification in data mining
A lot of people have this question. Professor Nathaniel E. Helwig, at the University of Minnesota, has provided in-depth information regarding this. According to him, “Discrimination attempts to separate distinct sets of objects, and classification attempts to allocate new objects to predefined groups.”
Discrimination and classification have two goals:
- Data description: To find “discriminants” that best separate groups, and
- Data allocation: To put new objects in groups via the “discriminants”.
The first goal is discrimination and the second goal is classification/allocation.
Prediction
You can find missing values in a dataset with the help of prediction. By using regression analysis, the prediction functionality distinguishes the inaccessible data items. In case a class label is missing, prediction is achieved using classification. Owing to its relevance in business, prediction is quite a popular functionality. One can forecast data in two ways:
- By predicting the missing or unavailable data with prediction analysis, and
- By predicting the class label leveraging the previously built model.
Prediction is a forecasting technique allowing users to project values for the future. A massive dataset of past values is required to forecast future trends.
Issues regarding classification and prediction in data mining
Both classification and prediction are used to extract models that describe important classes for predicting future trends. However, classification models predict categorical class labels while prediction models are used to predict continuous-valued functions.
Eg: A classification model can predict bank loans as safe or risky while a prediction model can project the expenditure of customers based on their occupation and income.
The major issue with both these functionalities is how to prepare the data. This involves the following steps:
- Data cleaning – Removing the noise by applying smoothening techniques and treating the missing values by replacing them with a commonly occurring value for the attribute.
- Relevance analysis – A database can have irrelevant attributes. Relevance analysis is applied to understand whether two attributes are related.
- Data transformation and reduction – Two processes are used here viz. Normalization and Generalization. Normalization involves scaling all the values within an attribute to make them confined within a small, specified range. Generalization is used for transforming data to the higher concept by using concept hierarchies.
Association analysis
Association analysis relates two or more attributes of data by finding the link between the data and the rule that binds it. This functionality associates qualities that regularly transact together. Two items associate the attributes – one is the confidence, a probability of association while the other is the support that provides the past occurrence of associations.
Eg: If laptops are bought with mouses, then support is 5% while confidence is 35%. This means that 5% of the time people bought a mouse when they purchased a laptop. The 35% is the probability that this will happen again.
Outlier analysis
This functionality is used for data components that cannot be grouped in any class or cluster. Such components are termed data anomalies. In other instance, there will be data components that have attributes different than the general models. These outstanding components are called outliers and are usually considered exceptions or noise. The analysis of these outliers is known as outlier mining. However, such components are not usually discarded in data mining in machine learning as they may disclose useful information in other areas.
Outliers are also referred to as surprises or exceptions and are identified using statistical tests that find out probability. They are also known as Deviants, Anomalies, Abnormalities, or Discordant.
Cluster analysis in data mining computer programs
Any unsupervised classification process is known as cluster analysis. Clustering is a process where data is arranged within the dataset based on similar features by using clustering algorithms. The objects that are grouped similarly fall in one cluster. There may be a significant difference in the sizes of different clusters. The grouping is done for maximizing the similarity between same class objects and minimizing the similarity among different classes.
Clustering is leveraged in many fields like pattern evaluation methods in data mining, machine learning, bioinformatics, and image processing.
Evolution & deviation analysis
Last but not the least, this functionality offers real-time clustering of data. By using the evolution and deviation analysis approach, a user can uncover hidden patterns, changes, or trends over a period of time. Features like periodicity, time-series data, and similarity in trends can be identified with this functionality.
Benefits of using these functionalities in data mining
We’re living in a data-centric world. Statista reports that the total data generated and consumed has reached 64.2 zettabytes in 2020. Data mining provides an effective approach in coping with such a massive amount of data with its aforementioned functionalities.
Some benefits of data mining in machine learning include:
- Enabling companies to gather reliable information,
- Allowing businesses to make profitable productions,
- Facilitating businesses in making informed decisions,
- Helping detect frauds and risks and improve product safety, and
- Aiding data scientists in quickly initiating automated predictions of trends and patterns.
What kind of data mining tools are available right now?
Data analysts leverage the following tools for data mining functionalities:
- Artificial intelligence (AI)
AI systems are capable of performing analytical functions that imitate human intelligence such as thinking, problem-solving, planning, and learning.
- Data analytics
By using data analytics, professionals evaluate digital transformation and turn it into useful intelligence.
- Clustering
The clustering process divides datasets into meaningful sub-classes, known as clusters. This process helps users understand the grouping or natural structure within a dataset.
- Data warehousing
This process consists of collecting extensive business data that is then processed to gain insights and make informed decisions. Data warehousing is a necessary and fundamental component of a majority of large-scale data mining projects.
- Machine learning
Machine learning is a computer programming technique employing statistical probabilities for computers to learn without human intervention or manual programming.
- Regression
This technique predicts a range of values that are based on information present in a particular dataset, such as temperature, stock prices, sales, etc.
Hire data entry experts in India
Data entry is a rapidly growing industry since data is becoming a quintessential element in most businesses. Data plays an important role because of its wide-reaching benefits:
- Marketing teams develop historical models for predicting future business trends.
- Effective data mining techniques ensure that every stakeholder in a company is on the same page.
- Keeping tabs on historical financial data makes it easier to tailor promotions to have more effect on the target audience. This means more returns on investment.
- Data mining can help identify what products or services have the highest demand. This way, brands can plan ahead and take better decisions.
- Effective data mining techniques also help businesses gather better resources for collating new data, thereby creating more growth opportunities.
However, experienced data scientists are hard to find. They are also not cheap. This is why the top brands prefer to outsource their data mining requirements. In the last decade, India has emerged as the hub of technology experts. Service providers like Virtual Employee don’t just scrap information from random sources and paste it onto an excel sheet. They use decades of experience and expertise in data mining to add value to your business. This is precisely why CEOs who hire data entry experts in India from Virtual Employee save up to 70% of their budget and use it to grow their business!
